概述
该策略综合运用平均真实波动范围(ATR)、相对强弱指数(RSI)以及移动止损来实现自适应的趋势跟踪。通过ATR来计算动态止损位,利用RSI判断市场趋势方向,移动止损跟踪价格波动实现利润最大化。这是一个非常典型的趋势跟踪策略。
策略原理
计算ATR。ATR反映市场的波动性和风险水平。本策略通过ATR计算动态止损位,实现自适应止损。
计算RSI。RSI可以判断市场的超买超卖现象。当RSI大于50时为看涨,小于50时为看跌。本策略利用RSI判断价格趋势方向。
移动止损跟踪。本策略根据ATR计算的止损位以及RSI判断的趋势方向,实现移动止损不断跟踪价格波动,在保证止损的同时逐步拉大止盈位,实现利润最大化。
具体来说,当RSI大于50时开多仓,小于50时开空仓。之后利用ATR计算的止损价位移动止损,跟踪价格波动。
优势分析
利用ATR实现自适应止损,可以根据市场波动性动态调整止损幅度,避免止损过大过小的缺点。
RSI判断趋势方向准确可靠,避免交易被困在震荡市中。
移动止损跟踪价格波动,可以拉大止盈位,充分跟踪趋势获利。
风险分析
ATR和RSI参数设置需要经过回测优化,否则会影响策略效果。
虽然有止损保护,但大幅跳空难以避免会使止损被突破的风险。可以适当缩小仓位以控制风险。
策略对交易品种参数优化依赖性较大,需要针对不同品种调整参数。
优化方向
可以考虑加入机器学习算法,实现参数的自适应优化。
增加仓位控制模块,可以根据市场情况动态调整仓位规模,降低突破止损的概率。
增加趋势判断指标,避免错过顶底反转点造成损失。
总结
本策略整合运用ATR、RSI和移动止损等模块,形成一个典型的自适应趋势跟踪策略。通过参数优化可以非常灵活地适应不同交易品种,是一个值得推荐的通用趋势跟踪策略。加入更多指标判断和机器学习算法优化后,本策略的效果还可进一步提升。
策略源码
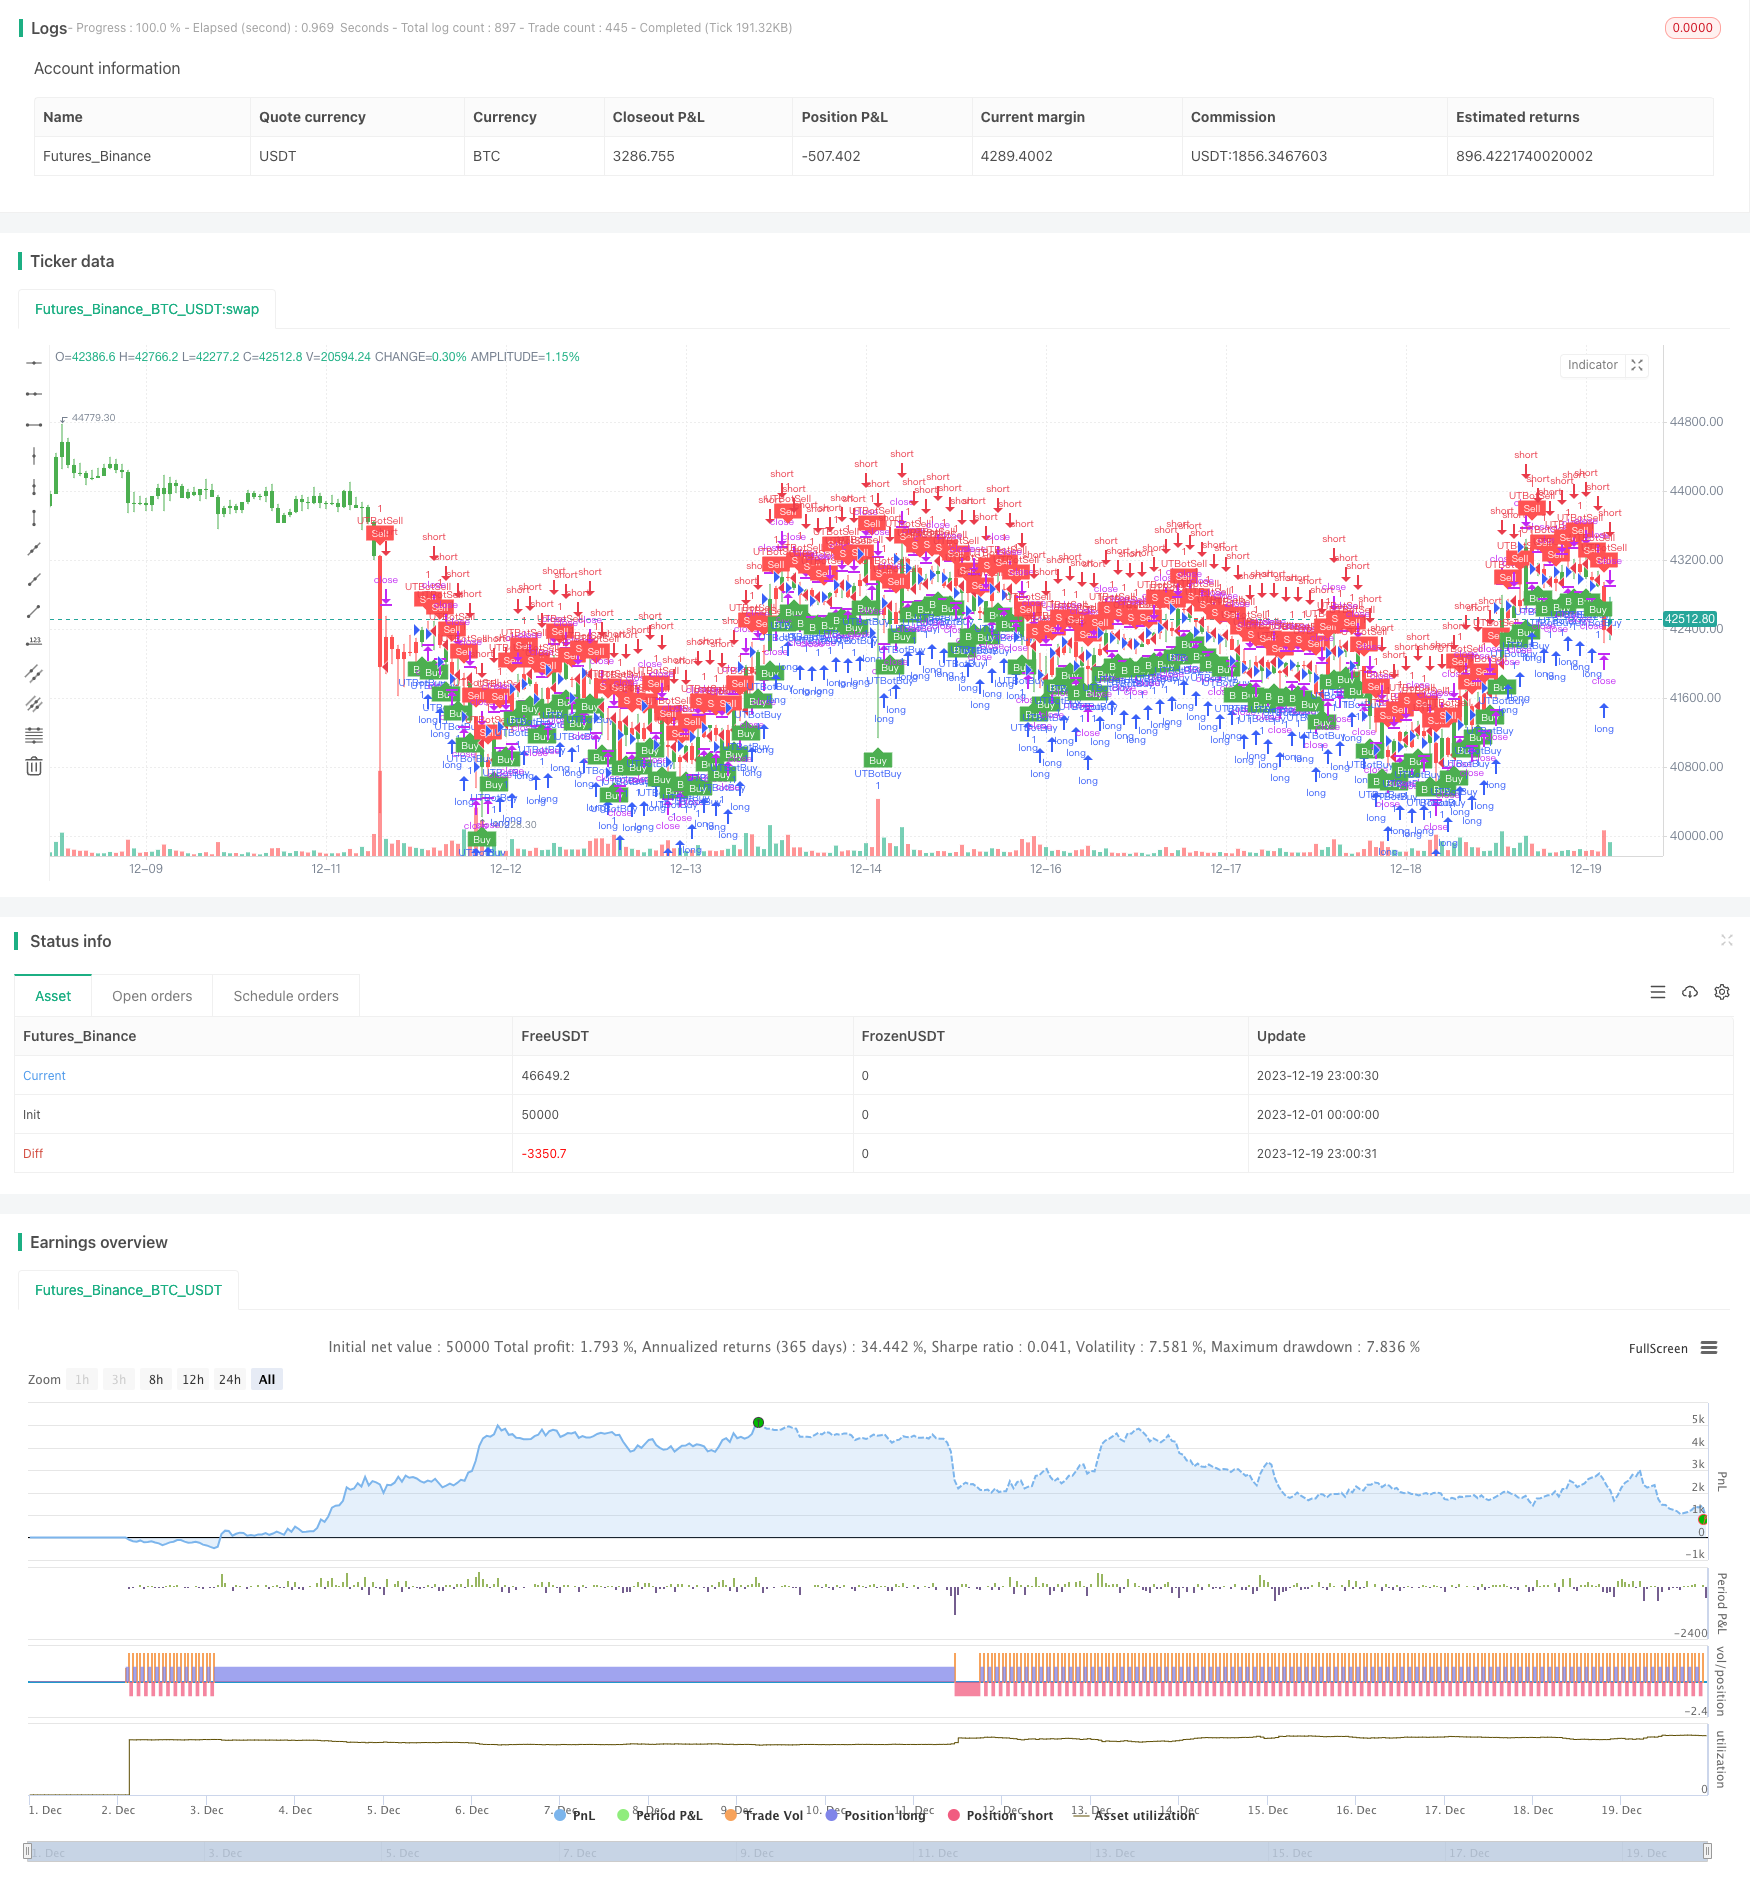
/*backtest
start: 2023-12-01 00:00:00
end: 2023-12-19 23:59:59
period: 1h
basePeriod: 15m
exchanges: [{"eid":"Futures_Binance","currency":"BTC_USDT"}]
*/

//@version=2
strategy(title="UTBot Strategy", overlay = true )

// CREDITS to @HPotter for the orginal code.
// CREDITS to @Yo_adriiiiaan for recently publishing the UT Bot study based on the original code -
// CREDITS to @TradersAITradingPlans for making this Strategy.
// Strategy fixed with Time period by Kirk65.
// I am using this UT bot with 2 hours time frame with god resultss. Alert with "Once per bar" and stoploss 1.5%. If Alerts triggered and price goes against Alert. Stoploss will catch it. Wait until next Alert.
// While @Yo_adriiiiaan mentions it works best on a 4-hour timeframe or above, witch is a lot less risky, but less profitable.

testStartYear = input(2019, "BACKTEST START YEAR", minval = 1980, maxval = 2222)
testStartMonth = input(01, "BACKTEST START MONTH", minval = 1, maxval = 12)
testStartDay = input(01, "BACKTEST START DAY", minval = 1, maxval = 31)
testPeriodStart = timestamp(testStartYear,testStartMonth,testStartDay,0,0)
testStopYear = input(2222, "BACKTEST STOP YEAR", minval=1980, maxval = 2222)
testStopMonth = input(12, "BACKTEST STOP MONTH", minval=1, maxval=12)
testStopDay = input(31, "BACKTEST STOP DAY", minval=1, maxval=31)
testPeriodStop = timestamp(testStopYear, testStopMonth, testStopDay, 0, 0)

testPeriod = true

SOURCE = input(hlc3)
RSILENGTH = input(14, title = "RSI LENGTH")
RSICENTERLINE = input(52, title = "RSI CENTER LINE")
MACDFASTLENGTH = input(7, title = "MACD FAST LENGTH")
MACDSLOWLENGTH = input(12, title = "MACD SLOW LENGTH")
MACDSIGNALSMOOTHING = input(12, title = "MACD SIGNAL SMOOTHING")
a = input(10, title = "Key Vaule. 'This changes the sensitivity'")
SmoothK = input(3)
SmoothD = input(3)
LengthRSI = input(14)
LengthStoch = input(14)
RSISource = input(close)
c = input(10, title="ATR Period")
xATR = atr(c)
nLoss = a * xATR
xATRTrailingStop = iff(close > nz(xATRTrailingStop[1], 0) and close[1] > nz(xATRTrailingStop[1], 0), max(nz(xATRTrailingStop[1]), close - nLoss),
     iff(close < nz(xATRTrailingStop[1], 0) and close[1] < nz(xATRTrailingStop[1], 0), min(nz(xATRTrailingStop[1]), close + nLoss),
     iff(close > nz(xATRTrailingStop[1], 0), close - nLoss, close + nLoss)))
pos =	iff(close[1] < nz(xATRTrailingStop[1], 0) and close > nz(xATRTrailingStop[1], 0), 1,
     iff(close[1] > nz(xATRTrailingStop[1], 0) and close < nz(xATRTrailingStop[1], 0), -1, nz(pos[1], 0)))
color = pos == -1 ? red: pos == 1 ? green : blue
ema= ema(close,1)
above = crossover(ema,xATRTrailingStop )
below = crossover(xATRTrailingStop,ema)
buy = close > xATRTrailingStop and above
sell = close < xATRTrailingStop and below
barbuy = close > xATRTrailingStop
barsell = close < xATRTrailingStop
plotshape(buy, title = "Buy", text = 'Buy', style = shape.labelup, location = location.belowbar, color= green,textcolor = white, transp = 0, size = size.tiny)
plotshape(sell, title = "Sell", text = 'Sell', style = shape.labeldown, location = location.abovebar, color= red,textcolor = white, transp = 0, size = size.tiny)
barcolor(barbuy? green:na)
barcolor(barsell? red:na)
//alertcondition(buy, title='Buy', message='Buy')
//alertcondition(sell, title='Sell', message='Sell')

if (buy)
    strategy.entry("UTBotBuy",strategy.long, when=testPeriod)
if (sell)
    strategy.entry("UTBotSell",strategy.short, when=testPeriod)