概述
该策略基于计算平均真实波幅(ATR)形成的通道进行交易。具体来说,是计算一定周期的SMA均线,再利用ATR值确定通道上下轨,当价格突破通道上轨时做多,当价格跌破通道下轨时做空,并在价格重新跌破SMA均线时平仓。
策略原理
该策略的核心逻辑基于平均真实波幅(ATR)通道。ATR指标可以有效反映市场的波动性和股价走势,通常用于确定止损线和盈利目标。策略首先计算n周期(默认150周期)的SMA均线,然后根据ATR值和参照系数确定通道上下轨的位置。具体计算公式如下:
上轨 = SMA均线 + ATR值 × 上轨系数(默认4) 下轨 = SMA均线 - ATR值 × 下轨系数(默认4)
当股价上涨突破上轨时,表示股价开始进入趋势通道,表明股价将继续上涨,此时做多;当股价下跌突破下轨时,表示股价开始反转下跌,此时做空。平仓信号为当股价重新跌破SMA均线时平掉所有的多单;当股价重新涨破SMA均线时平掉所有的空单。
策略优势
使用平均真实波幅ATR作为通道范围参考,能更准确捕捉市场波动。ATR可以有效衡量市场波动性,从而设置更合适的通道范围。
SMA均线+ATR通道,双重过滤确保交易信号更加可靠。只有在价格突破通道上下轨时才发出交易信号,避免了不必要的虚假信号。
通过参数优化,可以在最大程度上把握股价上涨和下跌的机会,利用趋势获利。通道宽度和周期都可以优化设置。
策略逻辑简单清晰易于理解,容易实施。基于指标和通道判断做多做空的思路非常直观。
包含做多做空双向交易策略,可以在股价上涨和下跌的行情中都获得收益。
风险分析
通道突破交易容易在关键节点发生亏损。如果突破是假突破,可能会在短期出现较大亏损。
SMA均线系统性风险较大,不能及时反映市场变化。价格可能已经进入下跌趋势但SMA均线尚未转折。
ATR和系数参数设置不当,会影响通道范围的合理性。
多头牛市行情下,空头交易会持续亏损。反之,空头熊市行情下,多头交易会持续亏损。
对应风险的解决方案: 1. 适当调整交易频率,降低假突破的风险。或者设置第二层过滤条件,避免在关键点位发生亏损。
结合MACD、KDJ等其他指标,对SMA做双重确认,避免系统性风险。
做好参数优化,选择合适的ATR周期和通道系数,确保通道范围合理。
根据大级别市场结构判断,选择趋势交易方向。牛市做多,熊市做空。
优化方向
该策略可以从以下几个方向进行优化:
增加其他技术指标过滤,避免假突破。可以在通道突破的同时检测MACD、KDJ等指标的信号,做多层确认。
优化ATR和通道系数参数,使通道范围更符合当前市场状态。这需要大量回测和优化来确定最佳参数组合。
增加自动止损策略,以控制单笔交易的最大亏损风险。移动止损是常见的可选方案。
可以在趋势偏离时及时止损。例如价格离开SMA均线超过一定范围时止损。
结合更大级别的市场结构分析指标,区分多空市做相应方向的突破交易。例如在周线级别确定趋势,然后在日内进行突破交易。
总结
该策略基于SMA均线+ATR通道双轨形式,在价格突破通道上下轨时进行相应方向的交易,是一种典型的通道突破策略。优点是双重指标过滤,突破信号相对可靠;缺点是存在一定程度假突破的风险。通过参数优化、增加止损策略、结合趋势判断等方面进一步完善,可以使策略更加可靠、符合市场结构,从而获得更稳定的收益。该策略简单易操作,值得进行探索和优化实践。
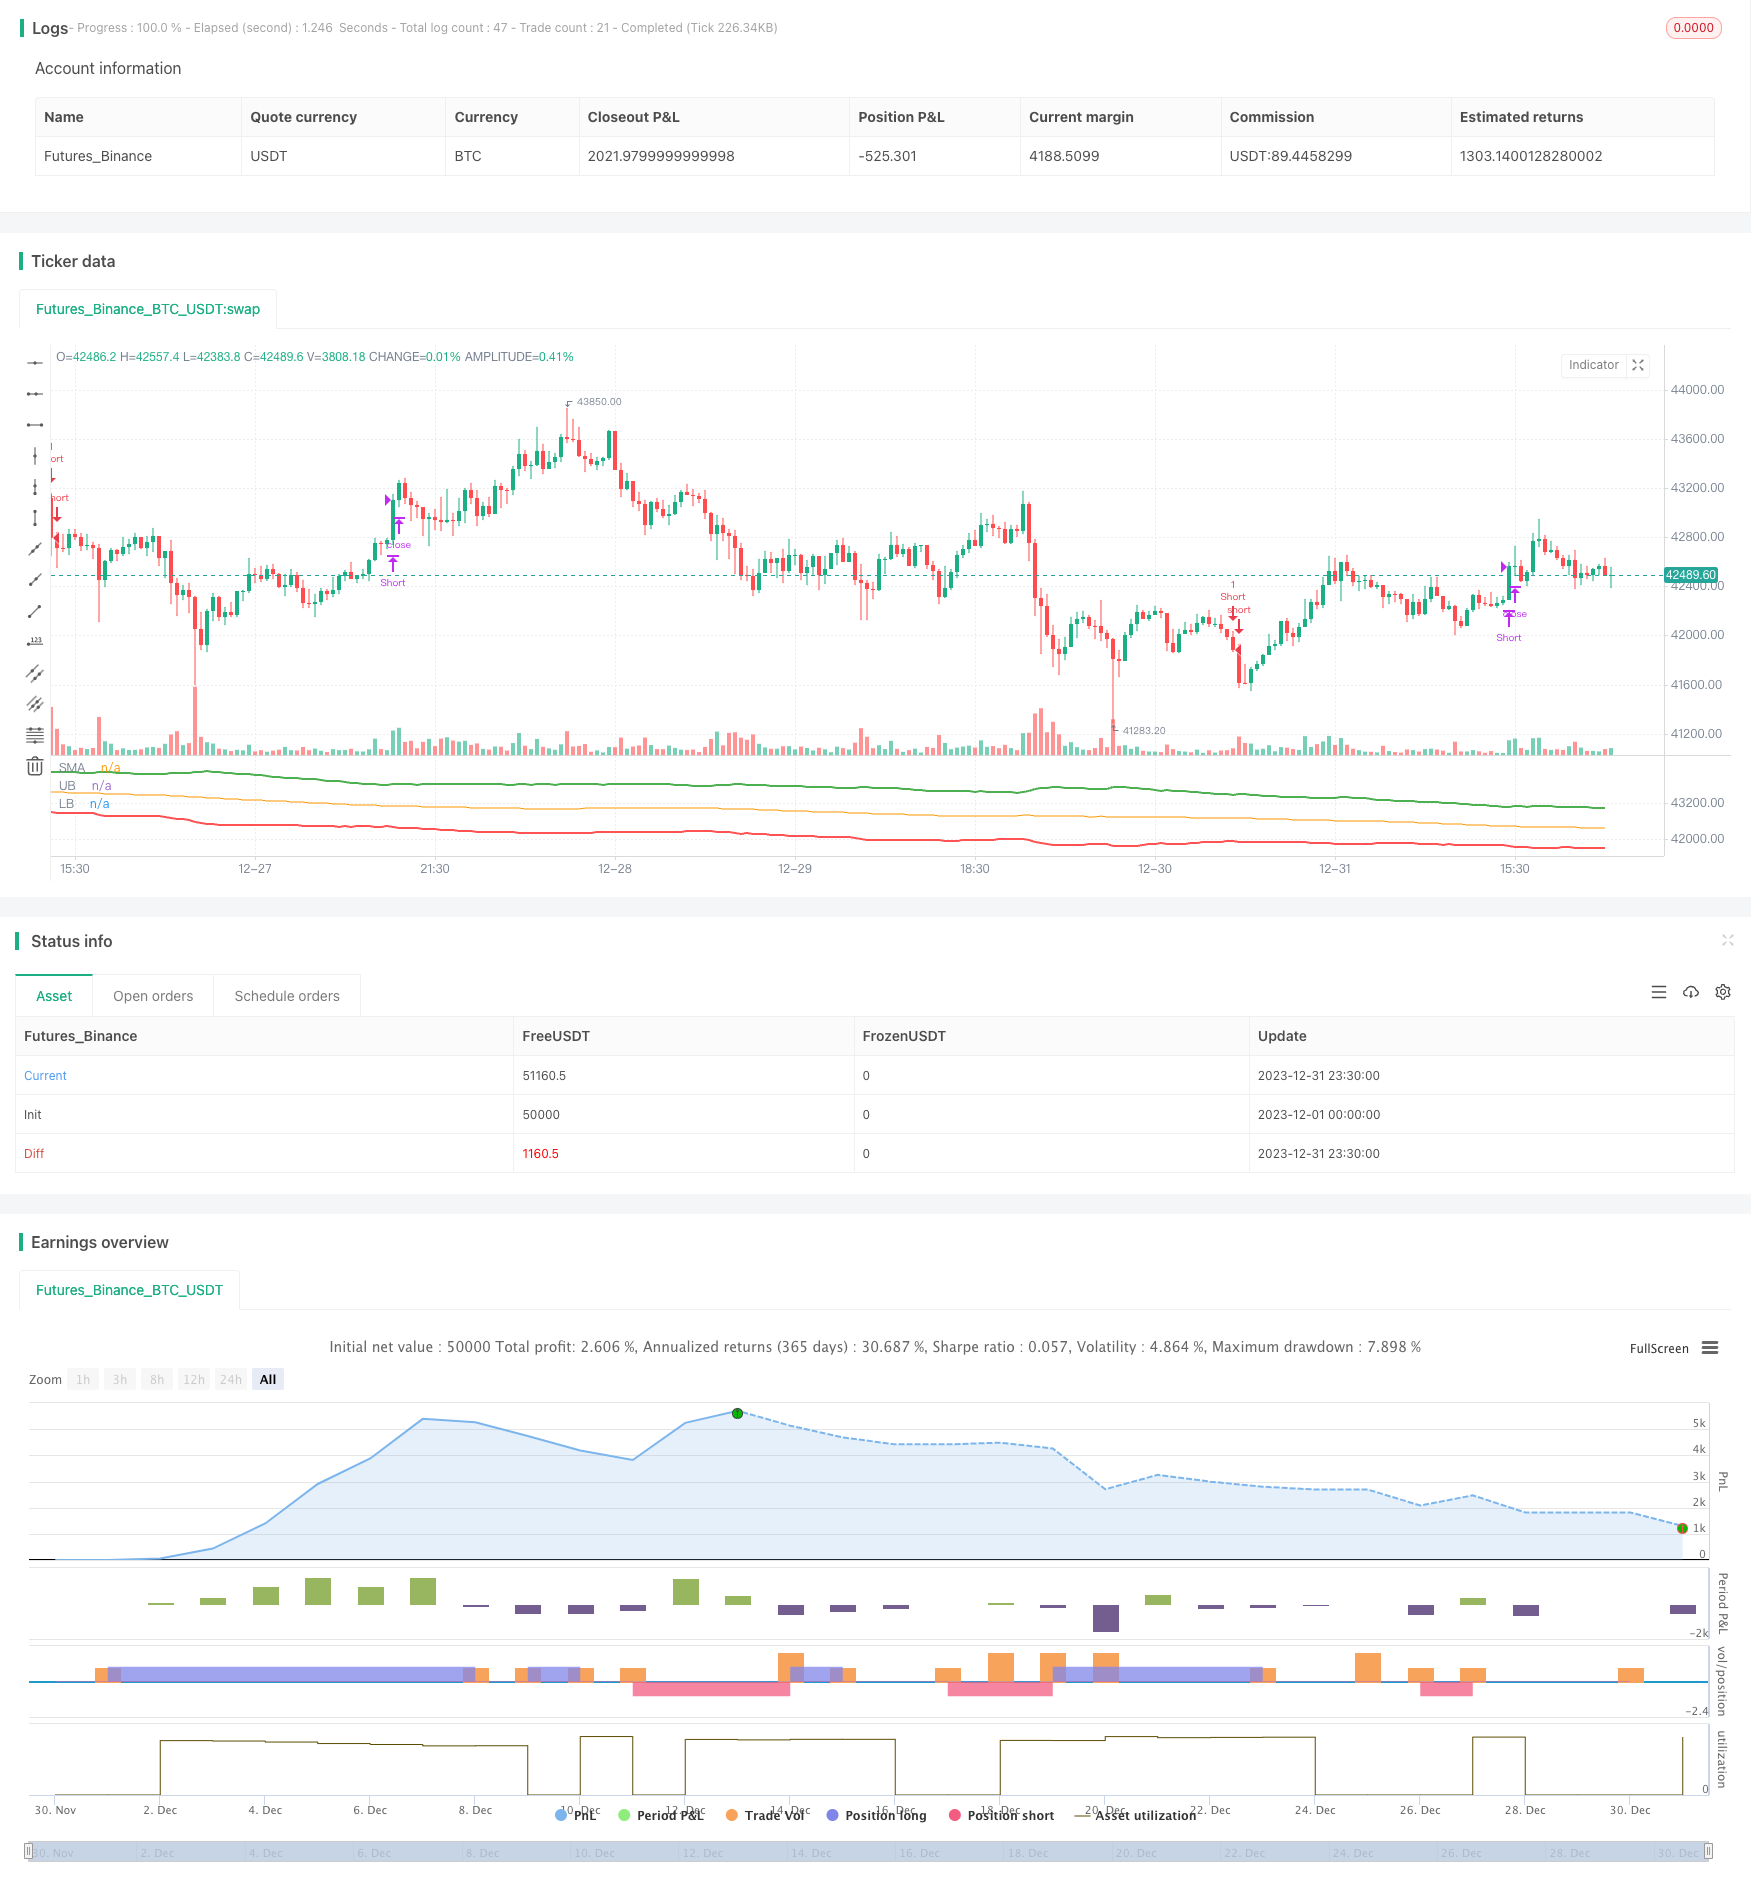
/*backtest
start: 2023-12-01 00:00:00
end: 2023-12-31 23:59:59
period: 30m
basePeriod: 15m
exchanges: [{"eid":"Futures_Binance","currency":"BTC_USDT"}]
*/

// This Pine Script™ code is subject to the terms of the Mozilla Public License 2.0 at https://mozilla.org/MPL/2.0/
// © omererkan

//@version=5
strategy(title="ATR Channel Breakout")

smaLength = input.int(150, title="SMA Length")
atrLength = input.int(30, title="ATR Length")

ubOffset = input.float(4, title="Upperband Offset", step=0.50)
lbOffset = input.float(4, title="Lowerband Offset", step=0.50)


smaValue = ta.sma(close, smaLength)
atrValue = ta.atr(atrLength)

upperBand = smaValue + (ubOffset * atrValue)
lowerBand = smaValue - (lbOffset * atrValue)


plot(smaValue, title="SMA", color=color.orange)
plot(upperBand, title="UB", color=color.green, linewidth=2)
plot(lowerBand, title="LB", color=color.red, linewidth=2)


enterLong = ta.crossover(close, upperBand)
exitLong  = ta.crossunder(close, smaValue)


enterShort = ta.crossunder(close, lowerBand)
exitShort  = ta.crossover(close, smaValue)


if enterLong
    strategy.entry("Long", strategy.long)

if enterShort
    strategy.entry("Short", strategy.short)


if exitLong
    strategy.close("Long", "Close Long")

if exitShort
    strategy.close("Short", "Close Short")