概述
该策略通过计算动量指标和恐慌指数的交叉来判断市场走势,在两个指标发生特定交叉时发出卖出信号,以捕捉大幅下跌行情。
策略原理
- 计算50周期动量指标。它表示价格相对于50周期前的变化。
- 计算22周期的恐慌指数修正值。它通过最高价和最低价的比值来表示市场的恐慌情绪。
- 当动量指标下穿恐慌指数时,表示市场存在下跌压力。
- 如果动量指标继续下跌进入危险区(-5到5之间),则发出强烈的卖出信号。
优势分析
- 利用市场交易情绪指标恐慌指数,可以有效判断市场结构性变化。
- 动量指标可以判断价格变化速度和力度,辅助判断市场趋势变化。
- 结合两种不同类型指标,可以提高识别突发事件的准确性。
- 通过调整参数,可以灵活适应不同市场环境。
风险分析
- 恐慌指数与动量指标交叉并不能保证每次都出现大幅下跌。需要综合其它指标确定最终决策。
- 卖出后没有设置止损,无法有效控制损失。
- 未考虑反转和再次入市问题。策略只适合捕捉突发性下跌。
优化方向
- 在卖出后设置止损点,控制损失。
- 增加其它指标判断,提高信号的可靠性。如成交量,布林线等。
- 增加再次入市信号,使策略可以完整运行长期周期。
- 对参数进行优化,找到最佳参数组合。
总结
该策略通过动量指标和恐慌指数的交叉来发出市场下跌警示。它可以有效捕捉市场的突发性下跌。但该策略仅适合短线应用,没有退出机制与风险控制。未来需要继续完善,使其成为一个长线可持续策略。
策略源码
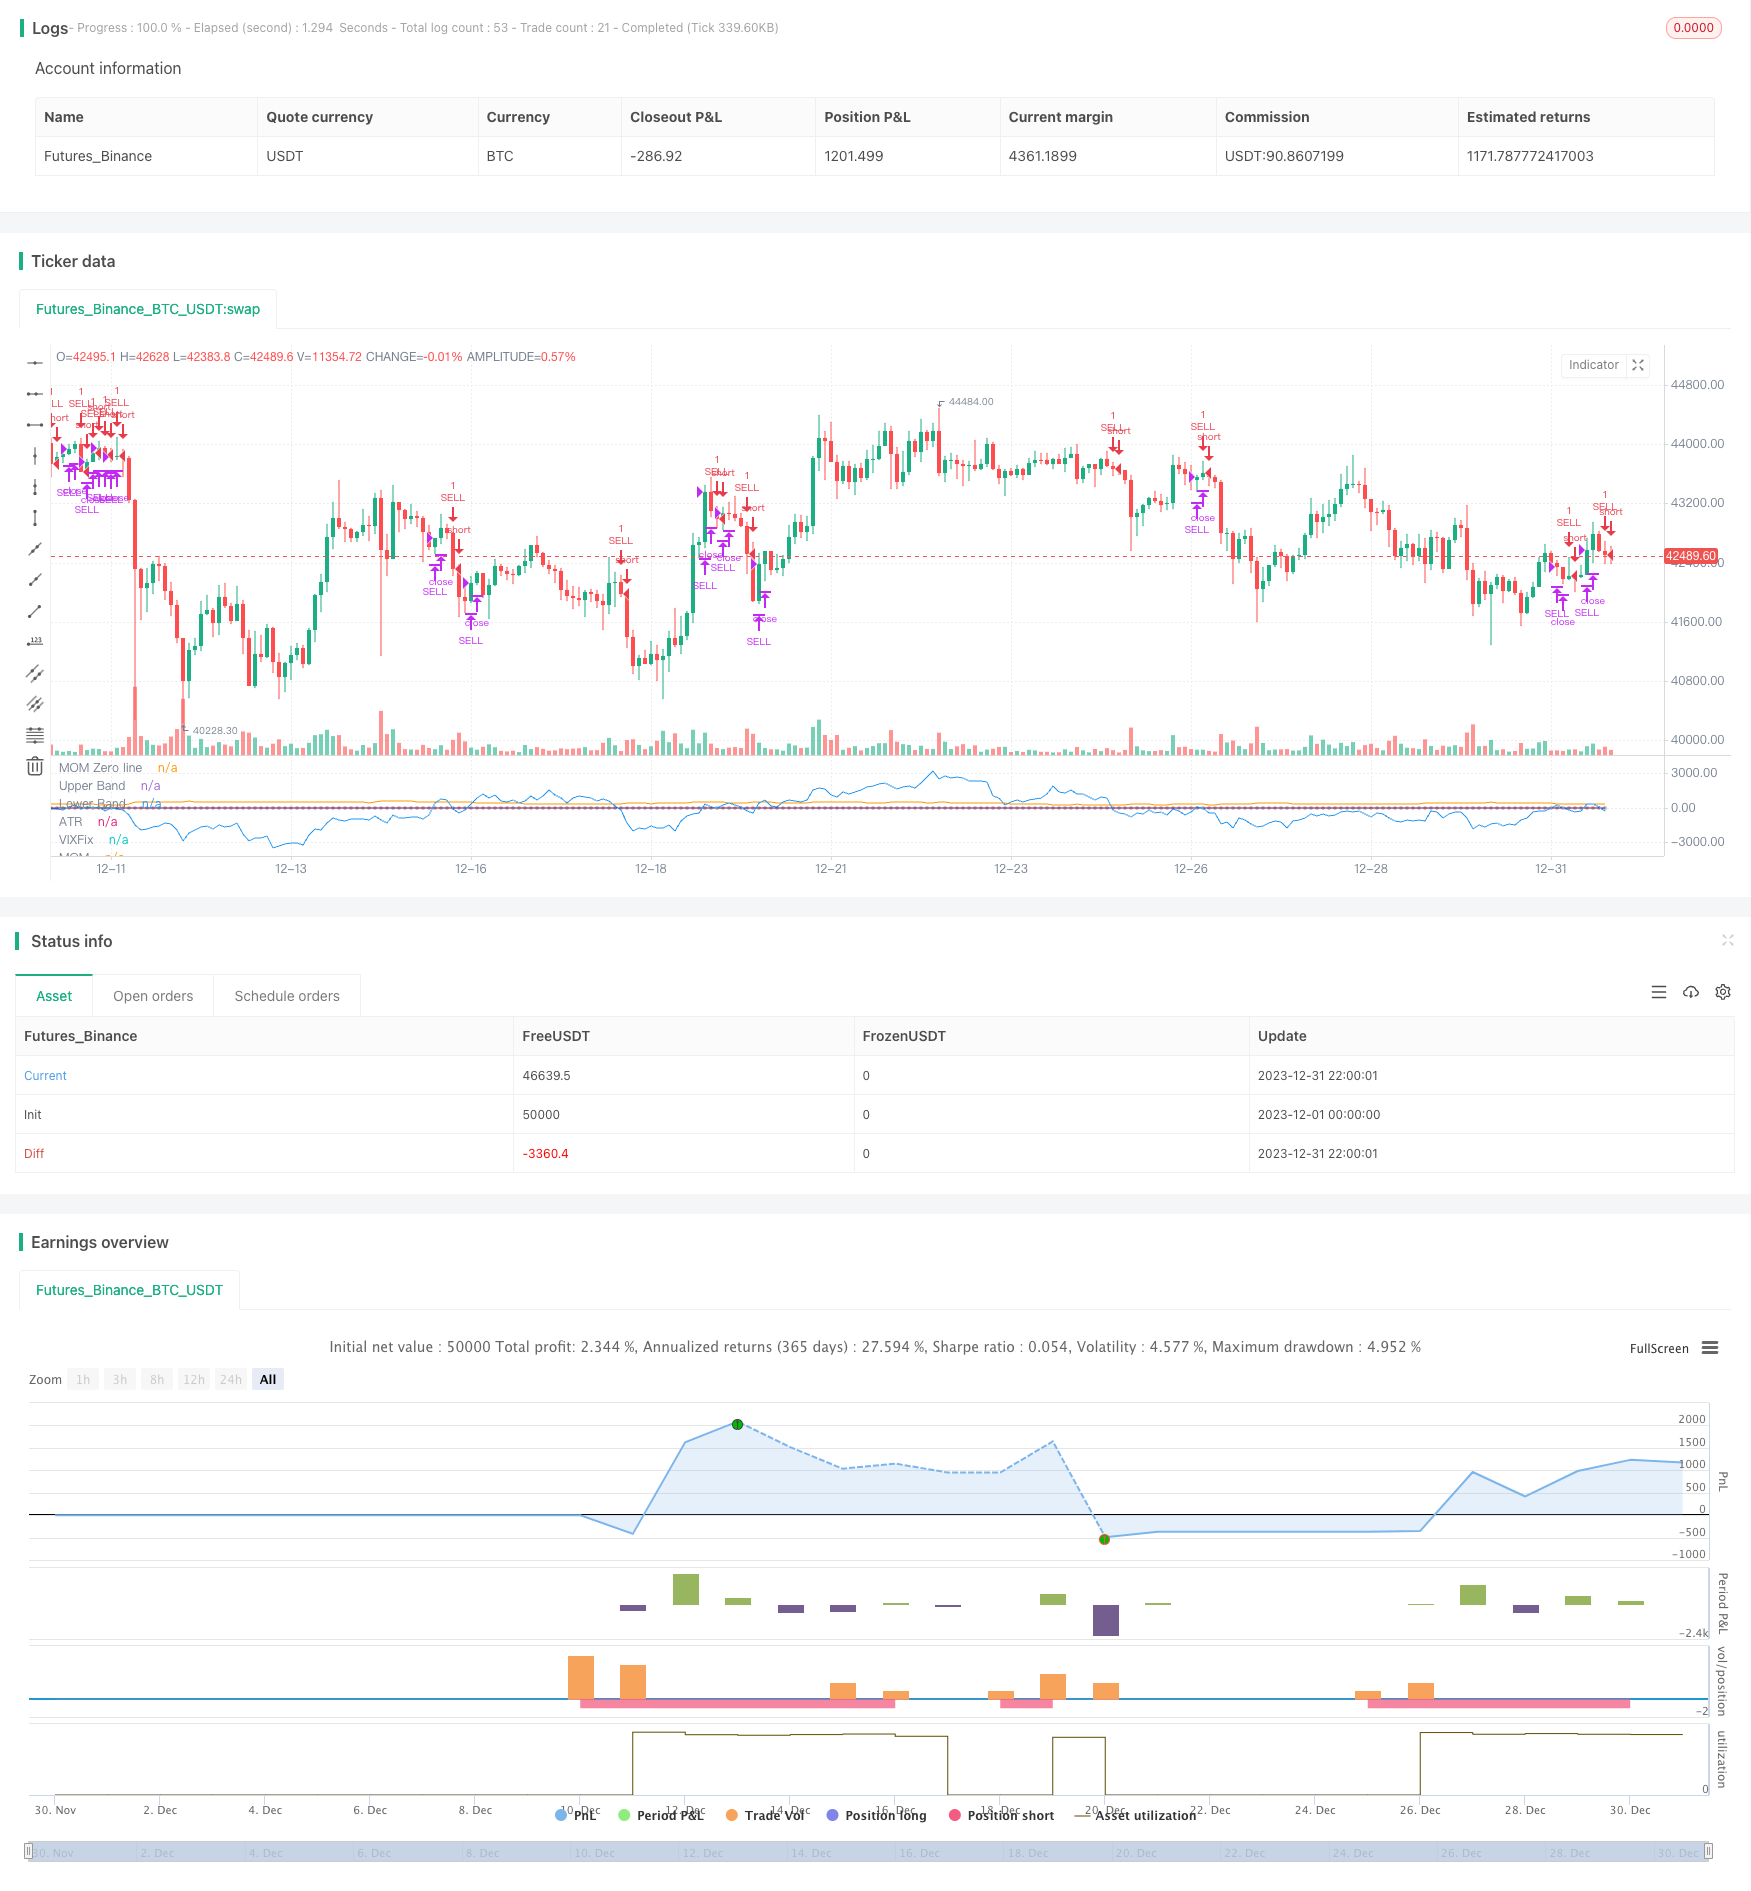
/*backtest
start: 2023-12-01 00:00:00
end: 2023-12-31 23:59:59
period: 2h
basePeriod: 15m
exchanges: [{"eid":"Futures_Binance","currency":"BTC_USDT"}]
*/

// This source code is subject to the terms of the Mozilla Public License 2.0 at https://mozilla.org/MPL/2.0/
// © gary_trades

//THIS SCRIPT HAS BEEN BUIL TO BE USED AS A S&P500 SPY CRASH INDICATOR (should not be used as a strategy).
//THIS SCRIPT HAS BEEN BUILT AS A STRATEGY FOR VISUALIZATION PURPOSES ONLY AND HAS NOT BEEN OPTIMISED FOR PROFIT.
//The script has been built to show as a lower indicator and also gives visual SELL signal on top when conditions are met. BARE IN MIND NO STOP LOSS, NOR ADVANCED EXIT STRATEGY HAS BEEN BUILT.
//As well as the chart SELL signal an alert has also been built into this script.
//The script utilizes a VIX indicator (marron line) and 50 period Momentum (blue line) and Danger/No trade zone(pink shading).
//When the Momentum line crosses down across the VIX this is a sell off but in order to only signal major sell offs the SELL signal only triggers if the momentum continues down through the danger zone.
//To use this indicator to identify ideal buying then you should only buy when Momentum line is crossed above the VIX and the Momentum line is above the Danger Zone.
//This is best used as a daily time frame indicator

//@version=4
strategy(title="S&P Bear Warning", shorttitle="Bear Warning" )

//Momentum
len = input(50, minval=1, title="Length")
src = input(close, title="Source")
bandUpper = input( 5)
bandLower = input(-5)
// ————— Control plotting of each signal. You could use the same technique to be able to turn acc/dist on/off.
showVixFix = input(true)
showMomentum = input(true)

mom = src - src[len]
myAtr = atr(14)
plot(showMomentum ? mom : na, color=color.blue, title="MOM")
plot(showMomentum ? 0 : na, color=color.silver, title="MOM Zero line", style=plot.style_circles, transp=100)
plot(showMomentum ? myAtr : na, color=color.orange, title="ATR", transp=90)

//VIX
VIXFixLength = input(22,title="VIX Fix Length")
VIXFix = (highest(close,VIXFixLength)-low)/(highest(close,VIXFixLength))*100
plot(showVixFix ? VIXFix : na, "VIXFix", color=color.maroon)

band1 = plot(showVixFix ? bandUpper : na, "Upper Band", color.red, 1, plot.style_line, transp=90)
band0 = plot(showVixFix ? bandLower : na, "Lower Band", color.red, 1, plot.style_line, transp=90)
fill(band1, band0, color=color.red, transp=85, title="Background")

//Identify Triggers
//Back Test Range
start = timestamp("America/New_York", 2000, 1, 1, 9,30)
end   = timestamp("America/New_York", 2020, 7, 1, 0, 0)

//Momentum
Long1 = mom > bandUpper
Short1 = mom < bandLower

//VIX
Long2  = crossover(mom, VIXFix)
Short2 = crossunder(mom, VIXFix)

//Warning Alert
SellAlert = Short1
alertcondition(SellAlert, title="Sell SPY", message="Warning Selling off {{ticker}}, price= {{close}}")

//Entry and Exit
if true
    strategy.entry("SELL", false, when = Short1)

strategy.close("SELL", when = Long2)