概述
该策略名称为“基于EMA通道和MACD的短线交易策略”。它结合了EMA通道和MACD指标来识别趋势,并给出交易信号。
策略原理
该策略使用5日EMA和21日EMA形成EMA通道。当5日EMA上穿21日EMA时,认为行情进入多头,当5日EMA下穿21日EMA时,认为行情进入空头。MACD指标的直方图可以用来过滤假信号。只有当MACD直方图大于0时,才会发出买入信号;只有当MACD直方图小于0时,才会发出卖出信号。一旦发出信号,就按固定止损和止盈下单。如果价格重新回到EMA通道内,会再次发出信号以追踪趋势。
优势分析
该策略结合趋势识别和指标过滤,可以有效识别短线行情的方向。利用EMA通道判断主要趋势方向,再用MACD指标过滤假信号,可以大幅提高获利概率。固定的止损止盈机制也保证了收益的风险收益比。整体来说,该策略适合短线交易,特别是在具有较强动量的股票和外汇品种中,效果会更好。
风险分析
该策略主要适用于短线交易,在长线和震荡行情下效果不佳。在长线横盘的市场中,EMA通道的交叉信号频繁,但大部分为假信号,此时MACD直方图虽可起到一定的过滤作用,但效果仍然有限。此外,固定的止损止盈机制使其难以抓住长线趋势带来的增量收益。所以这是该策略的主要风险。解决方法是根据市场情况灵活调整参数,或改用其他更适合当前市况的策略。
优化方向
该策略可以从以下几个方面进行优化: 1. 优化EMA的参数,寻找更匹配具体交易品种的收益率最大化的参数组合; 2. 优化MACD的参数,使其过滤效果更佳; 3. 结合波动率指标,当市场波动加大时,扩大止损范围; 4. 加入追踪止损机制,让止损更贴近价格,在保证盈利的前提下减少不必要的止损被触发的概率。
总结
该策略整体收益性较高,特别适合短线交易,在追求较高频率交易的量化交易策略中是一个不错的选择。但交易者在使用时,要注意根据市场行情合理调整参数,使策略收益最大化的同时,也要控制交易风险。
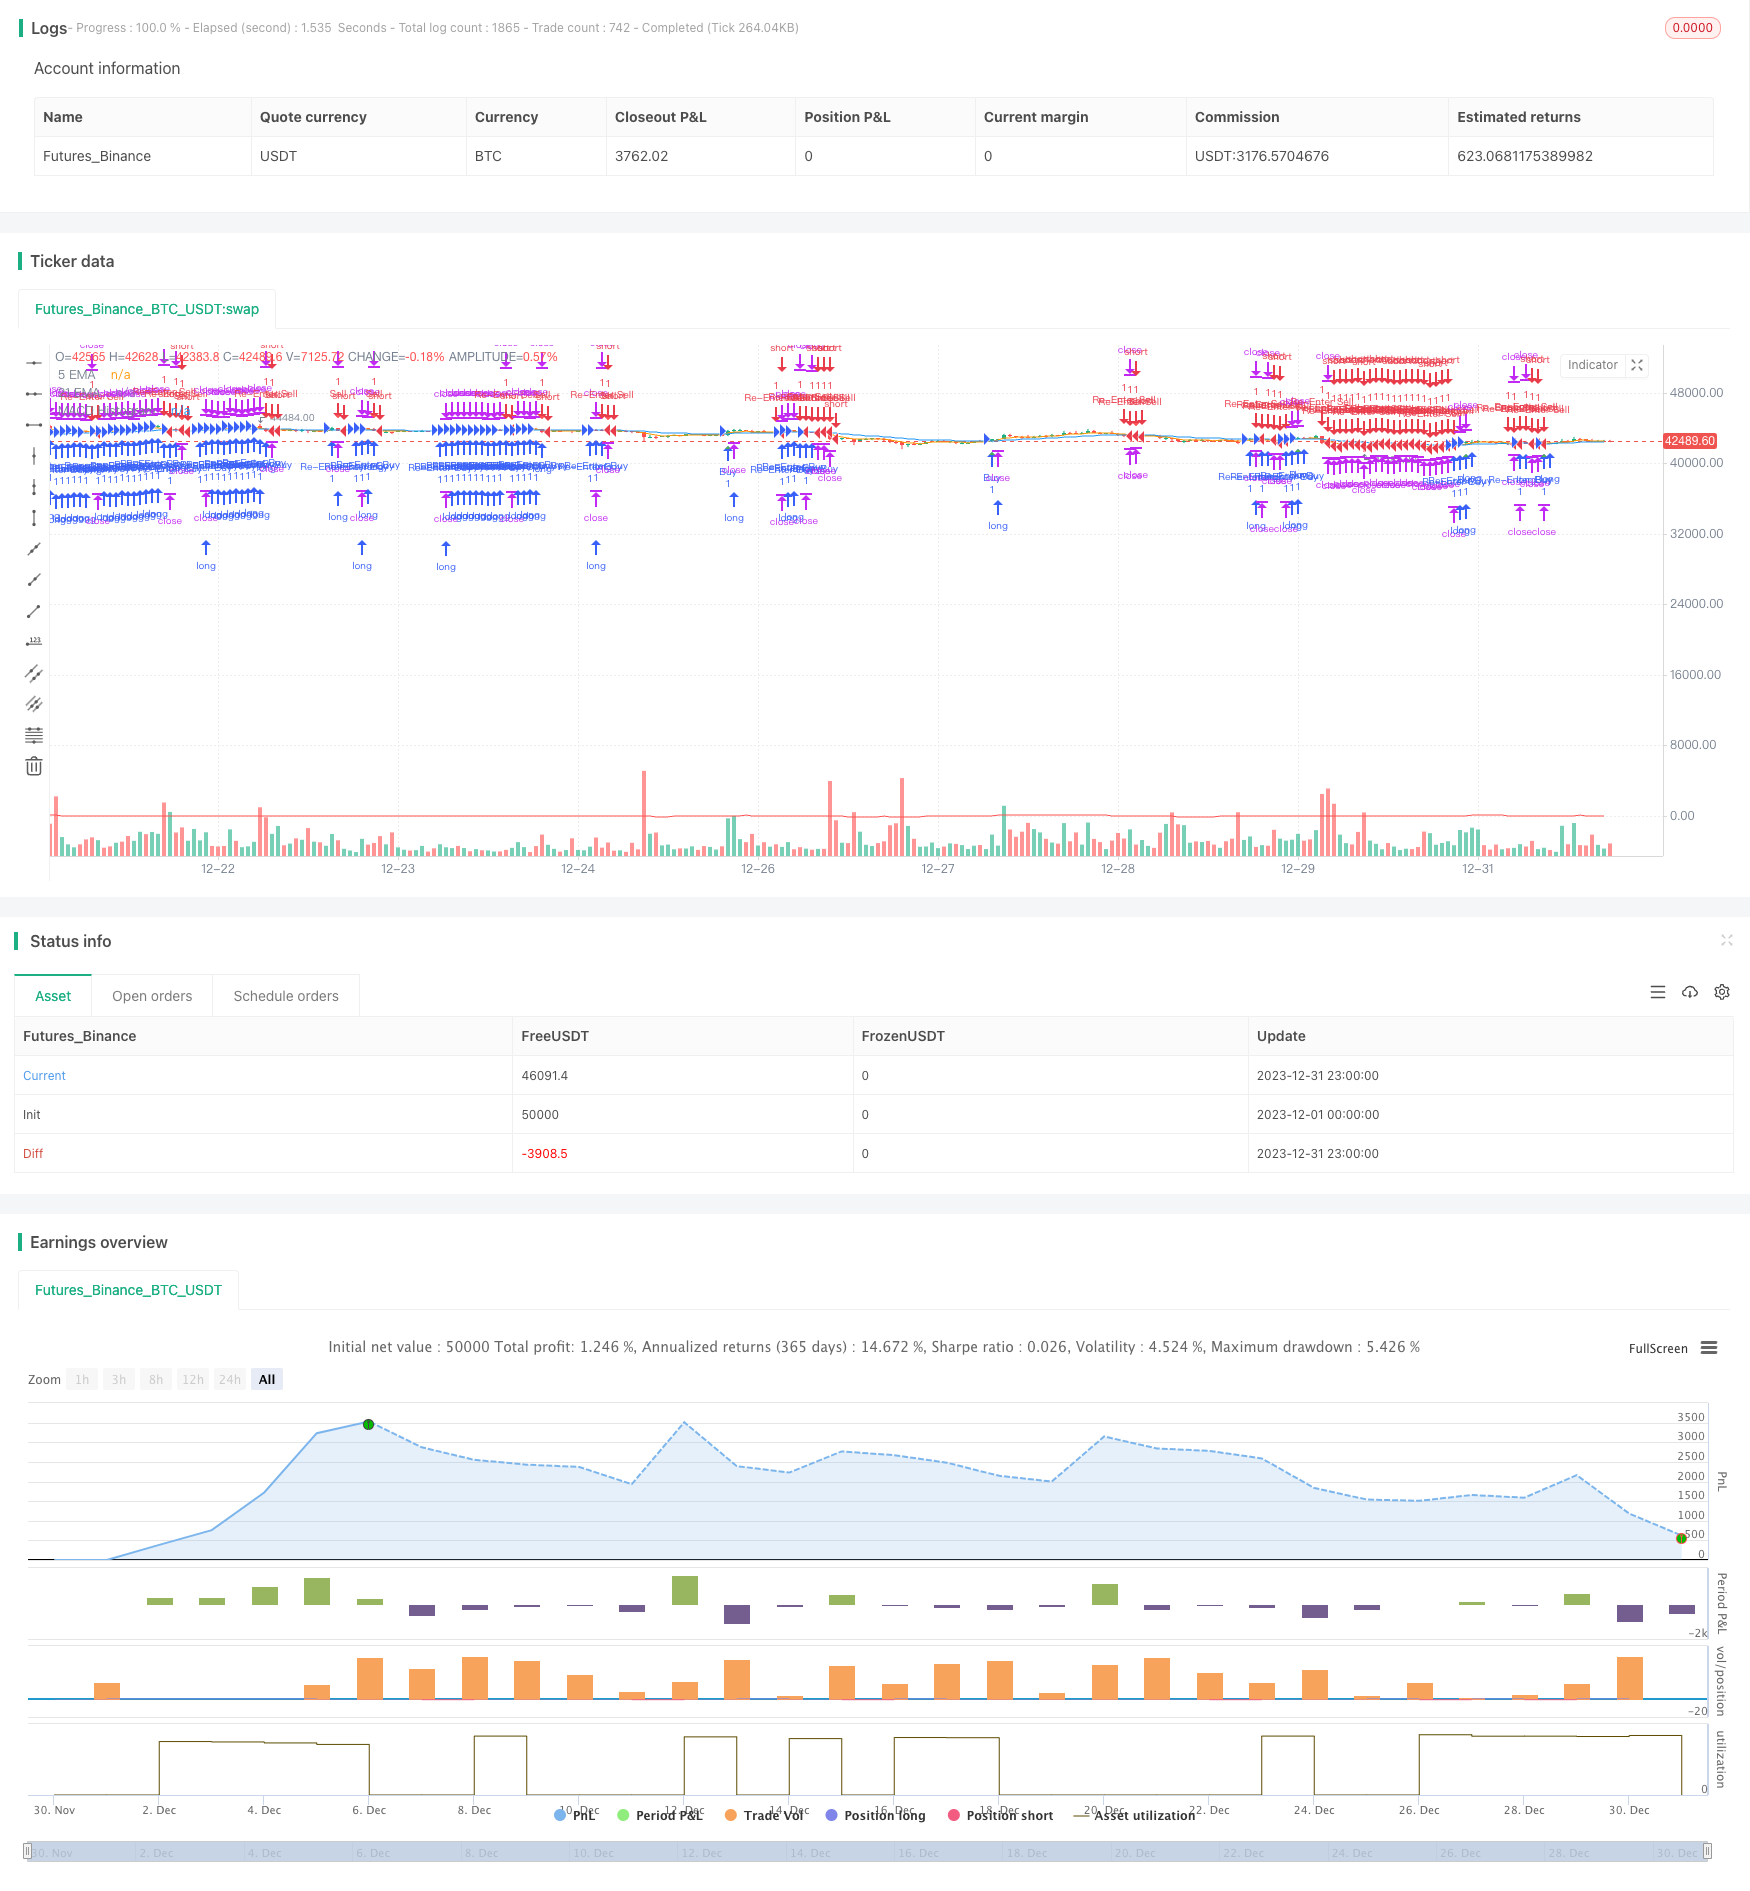
/*backtest
start: 2023-12-01 00:00:00
end: 2023-12-31 23:59:59
period: 1h
basePeriod: 15m
exchanges: [{"eid":"Futures_Binance","currency":"BTC_USDT"}]
*/

// This source code is subject to the terms of the Mozilla Public License 2.0 at https://mozilla.org/MPL/2.0/
// © moondevonyt

//@version=5
strategy("Scalping with EMA channel and MACD", overlay=true)

// Exponential moving average inputs
ema21 = ta.ema(close, 21)
ema5 = ta.ema(close, 5)

// MACD inputs
fastLength = 18
slowLength = 34
signalSmoothing = 12

[macdLine, signalLine, _] = ta.macd(close, fastLength, slowLength, signalSmoothing)
macdHistogram = macdLine - signalLine

// Buy and sell conditions
buyCondition = ta.crossover(ema5, ema21) and macdHistogram > 0
sellCondition = ta.crossunder(ema5, ema21) and macdHistogram < 0

// Re-entry conditions
reEntryBuyCondition = close > ema21
reEntrySellCondition = close < ema21

// Set stop loss and take profit
stopLoss = 8
takeProfit = 15

// Execute Strategy
if buyCondition
    strategy.entry("Buy", strategy.long)
    strategy.exit("Take Profit/Stop Loss", "Buy", stop=close - stopLoss, limit=close + takeProfit)
if reEntryBuyCondition
    strategy.entry("Re-Enter Buy", strategy.long)
    strategy.exit("Take Profit/Stop Loss", "Re-Enter Buy", stop=close - stopLoss, limit=close + takeProfit)

if sellCondition
    strategy.entry("Sell", strategy.short)
    strategy.exit("Take Profit/Stop Loss", "Sell", stop=close + stopLoss, limit=close - takeProfit)
if reEntrySellCondition
    strategy.entry("Re-Enter Sell", strategy.short)
    strategy.exit("Take Profit/Stop Loss", "Re-Enter Sell", stop=close + stopLoss, limit=close - takeProfit)

// Plotting EMAs and MACD
plot(ema21, color=color.blue, title="21 EMA")
plot(ema5, color=color.orange, title="5 EMA")
plot(macdHistogram, color=color.red, title="MACD Histogram")

// Plot buy and sell signals
plotshape(series=buyCondition, style=shape.triangleup, location=location.belowbar, color=color.green, size=size.small, title="Buy Signal")
plotshape(series=sellCondition, style=shape.triangledown, location=location.abovebar, color=color.red, size=size.small, title="Sell Signal")