概述
大神波动带RSI交易策略通过结合波动带指标和相对强弱指数(RSI)指标,在价格突破上轨且RSI指标显示为超卖信号时产生买入信号;当价格跌破上轨且RSI指标显示为超买信号时产生卖出信号。该策略主要利用波动带指标判断市场波动的节奏变化,结合RSI指标发现超买超卖现象,在反转点位发出交易信号。
策略原理
该策略的核心逻辑基于以下几点:
计算20日的收盘价简单移动平均线作为基准中轨。
在中轨的基础上计算上下轨,上轨为中轨+2倍的20日收盘价标准差,下轨为中轨-2倍的20日收盘价标准差。构成波动带。
计算14日RSI指标判断超买超卖现象。RSI低于20为超卖,高于70为超买。
当收盘价由下向上突破上轨,且RSI指标显示超卖信号,产生买入信号。
当收盘价由上向下跌破上轨,且RSI指标显示超买信号,产生卖出信号。
该策略通过波动带指标判断价格波动的节奏和速度,并结合RSI指标发现反转点位,在可能的反转点发出交易信号。
优势分析
波动带指标能判断市场的波动节奏和方向,RSI指标判断超买超卖现象,两者结合形成有效的交易信号。
RSI指标参数可调节,可以根据不同市场设置不同的超买超卖水平,避免错误信号。
波动带参数也可以调整,根据市场波动范围和速度设定合适的参数,提高获利概率。
突破上轨形成买入信号,跌破上轨形成卖出信号,简单易懂的交易逻辑。
可同时用于股市、外汇和数字货币等市场。
风险分析
市场持续向上时,可能造成多次误判买入信号。可通过优化RSI参数降低错误信号率。
震荡行情中,波动带上下轨震荡频繁,可能导致频繁交易亏损。可适当放宽突破参数,减少无谓交易。
代码中假设超买超卖标准固定,实际上应该根据不同市场波动程度设定参数。
波动带和RSI指标都存在滞后,不能提前预测价格走势,只能追踪价格变化。
优化方向
根据不同市场的特点,调整波动带参数,增大波动带宽度,降低误交易概率。
RSI参数也需要针对不同市场调整,适当调高超买超卖标准,避免多次触发错误交易信号。
增加其他指标判断,如KDJ、MACD等,避免波动带和RSI单一指标判断错误。
增加止损策略,设定合理的止损点,避免单次亏损过大。
可考虑 Breakout 突破或回测测试参数优化,进一步提高策略稳定性。
总结
大神波动带RSI交易策略通过波动带指标判断价格波动速度和RSI指标判断超买超卖现象,在可能的反转点发出交易信号。该策略整合了多个指标优势,交易逻辑简单清晰,可广泛适用于股市、外汇、数字货币等交易市场,是一种有效的趋势交易策略。但也存在一定改进空间,可从调整参数、增设指标、止损机制等多方面进行优化,使策略更稳定可靠。
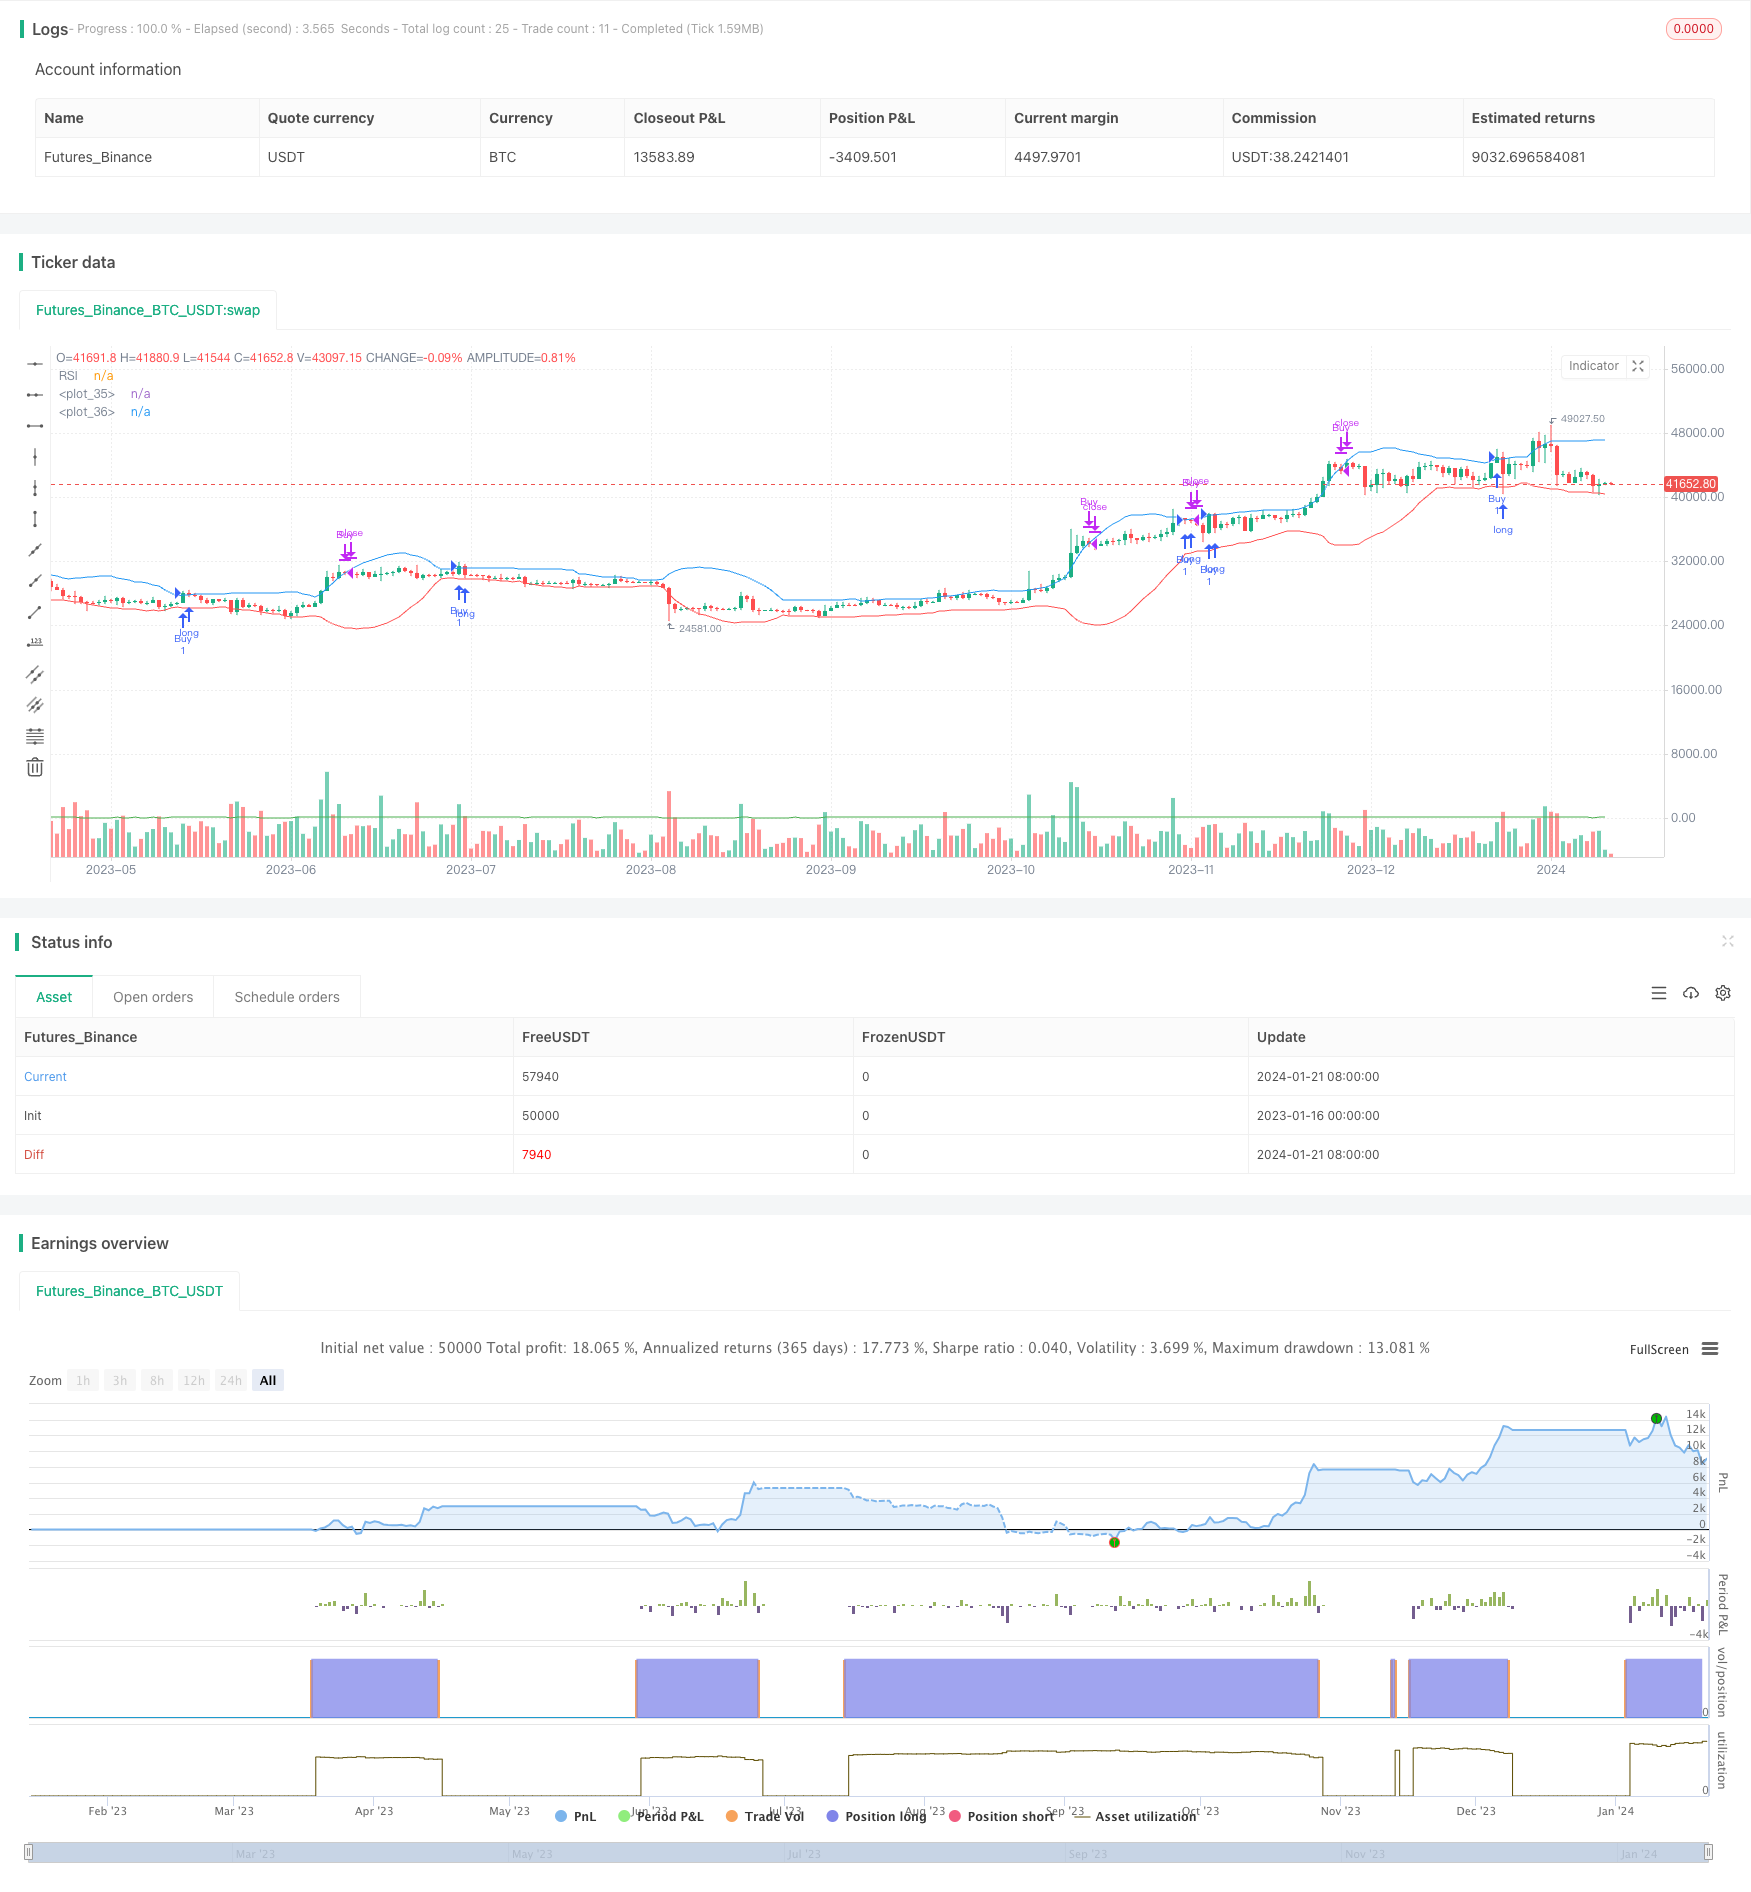
/*backtest
start: 2023-01-16 00:00:00
end: 2024-01-22 00:00:00
period: 1d
basePeriod: 1h
exchanges: [{"eid":"Futures_Binance","currency":"BTC_USDT"}]
*/

//@version=4
strategy("Bollinger Band + RSI Strategy", overlay=true)

// Input variables
numCandlesOutsideBB = input(3, "Number of Candles Outside BB")
numCandlesOutsideUpperBB = input(3, "Number of Candles Outside Upper BB")
rsiLength = input(14, "RSI Length")
rsiOversoldLevel = input(20, "RSI Oversold Level")
rsiOverboughtLevel = input(70, "RSI Overbought Level")

// Bollinger Bands
length = input(20, minval=1, title="BB Length")
mult = input(2.0, minval=0.001, maxval=50, title="BB Standard Deviation")
basis = sma(close, length)
dev = mult * stdev(close, length)
upperBB = basis + dev
lowerBB = basis - dev

// RSI
rsi = rsi(close, rsiLength)

// Buy condition
buyCondition = crossover(close, upperBB) and rsi > rsiOversoldLevel

// Sell condition
sellCondition = crossunder(close, upperBB) and rsi > rsiOverboughtLevel

// Strategy
if buyCondition
    strategy.entry("Buy", strategy.long)
if sellCondition
    strategy.close("Buy")

// Plotting
plot(upperBB, color=color.blue)
plot(lowerBB, color=color.red)
plot(rsi, "RSI", color=color.green)