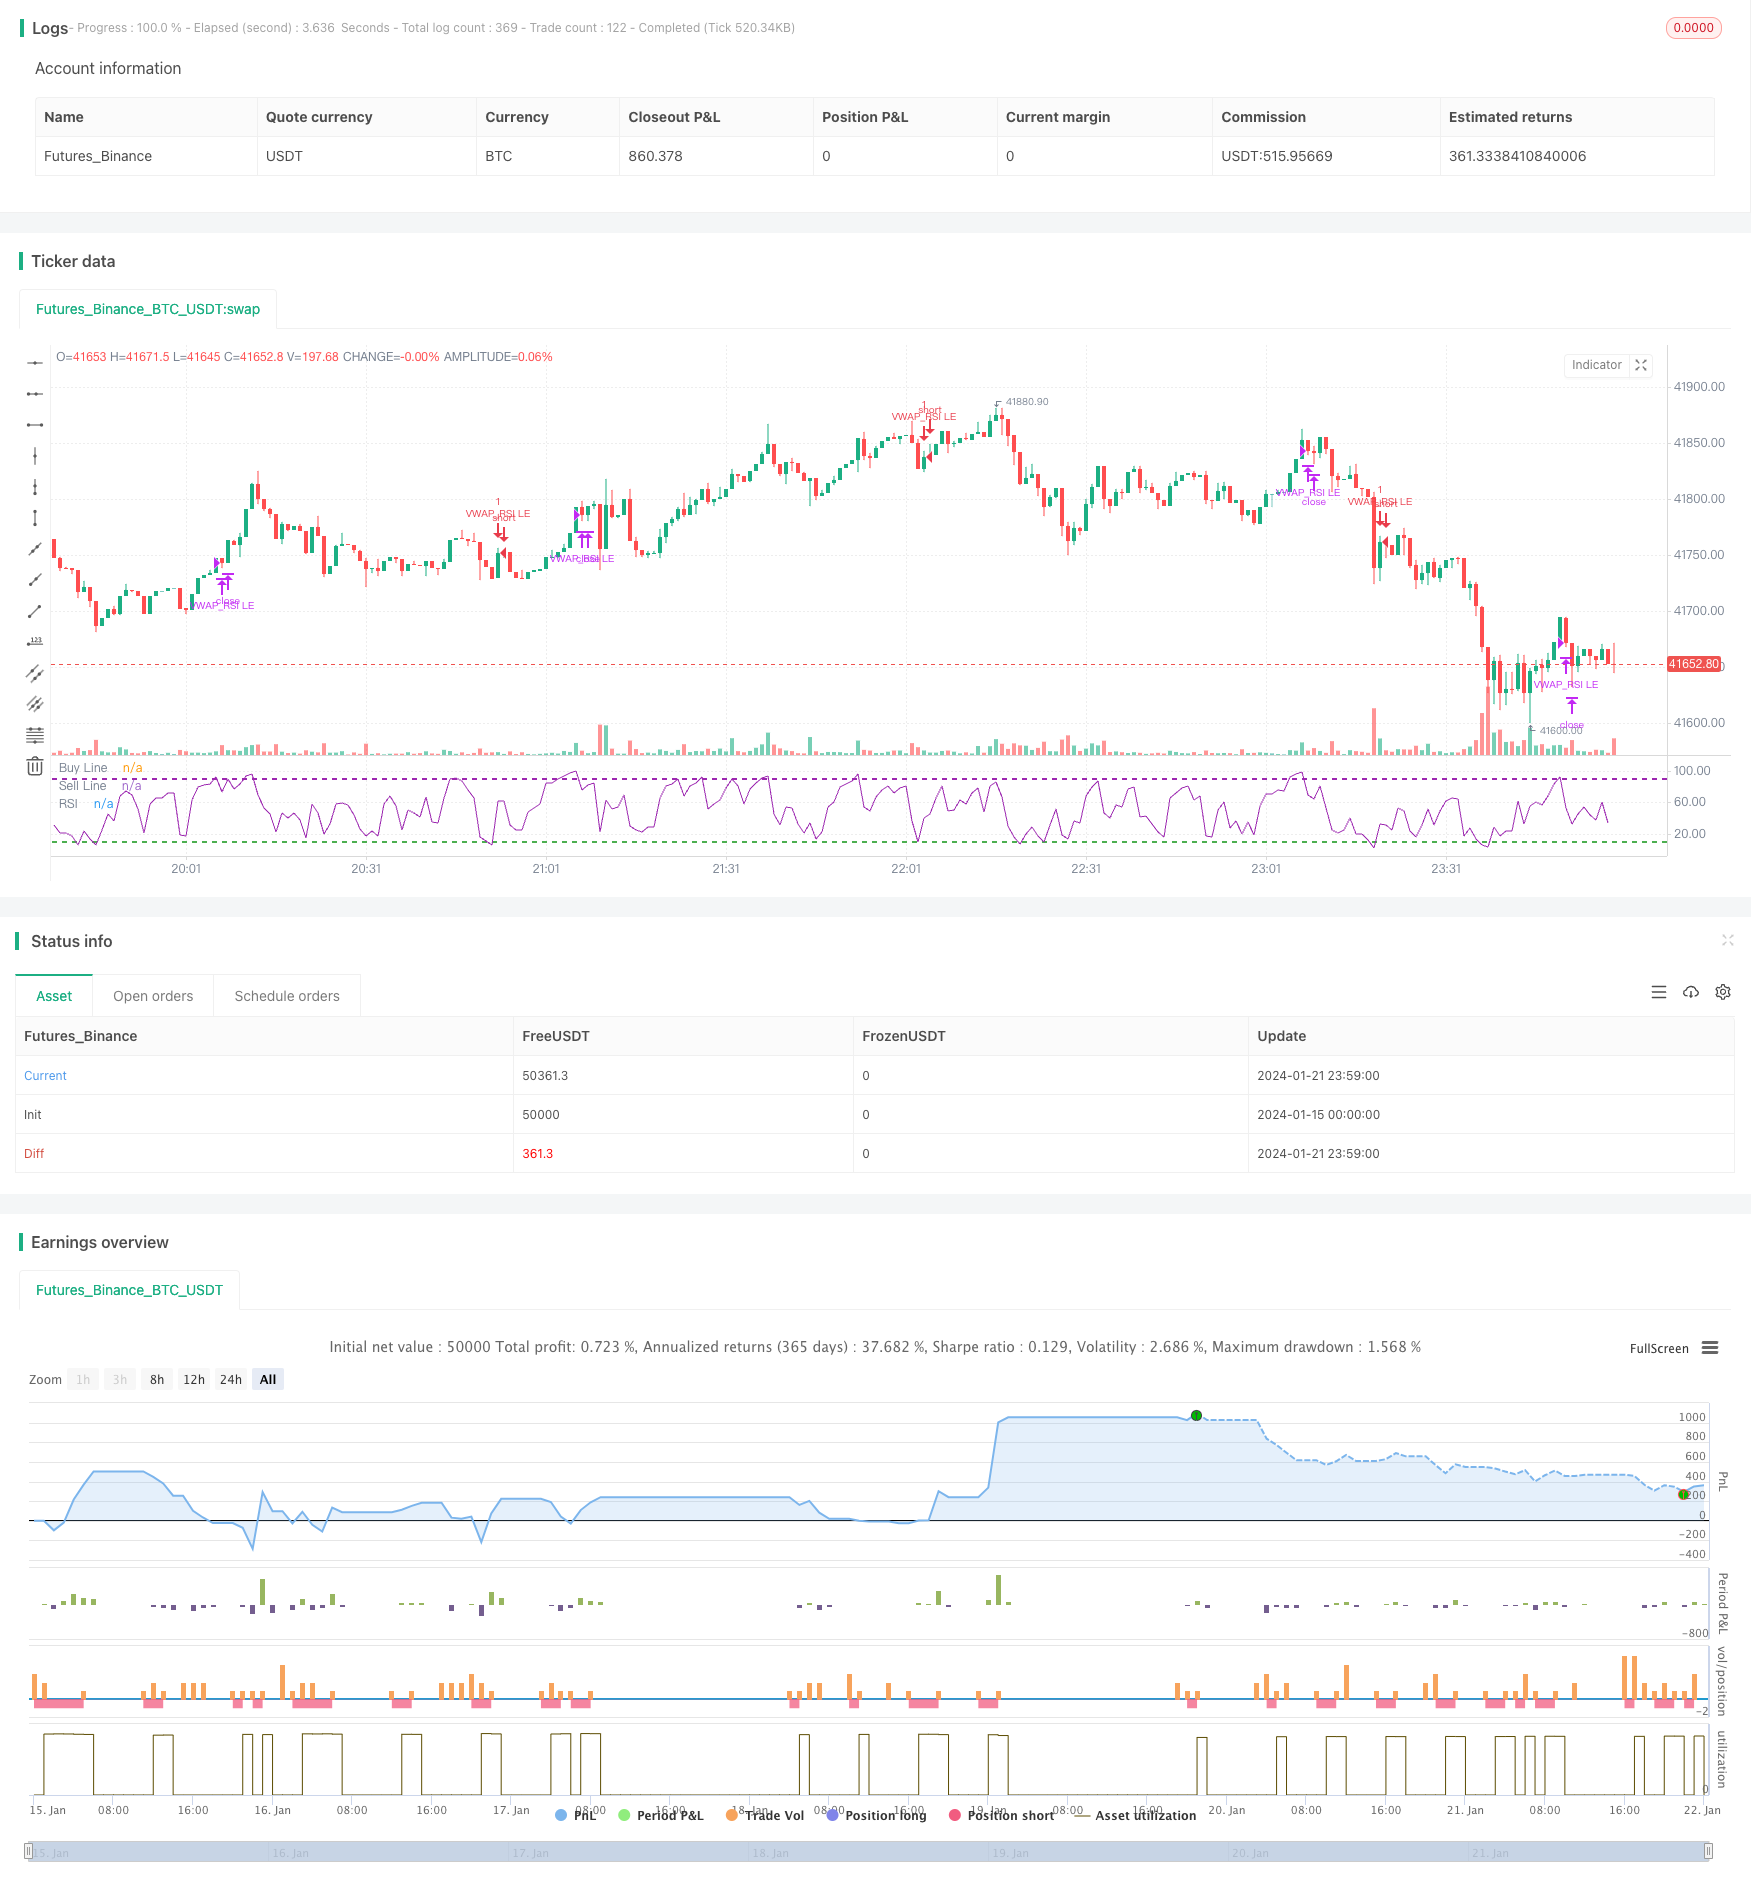
概述
本策略名称为“跟踪型价值加权平均价与相对强弱指标组合策略”。该策略运用价值加权平均价(VWAP)和相对强弱指数(RSI)两个指标,实现了趋势追踪进入与超买超卖退出的组合策略。
策略原理
该策略的交易逻辑主要基于以下几点:
- 使用50日指数移动平均线从上突破200日线作为判断行情向上的信号
- 当收盘价高于该交易日的VWAP价值,并且收盘价高于开盘价时,认为行情走强,可以入场
- 如果前10根K线中,RSI指标有至少一根K线低于10,则视为超卖形态,是一个强力的入场信号
- 当RSI指标再次向下交叉90这一超买区域时,选择退出场外
- 设定5%的止损线,避免损失过大
以上就是该策略的基本交易逻辑。通过EMA判断大趋势,VWAP判断当日趋势,RSI判断超买超卖区域,实现了多种指标的有效结合,既确保了交易的主方向正确,又增加了入场和退出的信号效果。
策略优势分析
该策略最大的优势在于指标的组合使用。单一的VWAP并不能完美应对所有的市场情况,此时引入RSI的辅助,可以识别一些短期的超卖突破点位带来的交易机会。另外,EMA的应用也使得只有大周期向上的行情才选择入场,避免被短期调整反转所套牢。
这种组合指标的使用方式也增加了策略的稳定性。在RSI出现一两次假突破的情况下,还有VWAP和EMA做后盾,不大可能产生错误交易。同理,当VWAP产生假突破时,也有RSI指标的确认。所以这种组合使用大大提高了策略实施的成功率。
策略风险分析
该策略的主要风险在于VWAP指标的使用。VWAP代表当日的平均成交价格,但是并不是每一天的价格波动都围绕VWAP上下波动。所以VWAP突破的信号不一定能确保后市的价格真的可以持续突破。当出现伪突破时可能造成交易上的亏损。
此外,RSI指标容易产生分歧口。当市场处于震荡盘整阶段时,RSI可能来回触及多次超买超卖区域,造成交易信号的频繁输出。这种情况下,如果盲目跟随RSI信号进行交易,也会面临一定的风险。
对此,我们在策略中采用EMA指数移动平均线作为大周期判断,只在大周期向上时考虑交易,这可以一定程度上避免上述两个问题对策略造成的影响。此外设定止损线,也可以使单次亏损控制在一定范围内。
策略优化方向
该策略还有进一步优化的空间,主要集中在以下几个方面:
引入更多指标进行组合。比如卡尔曼均线,布林带等,使交易信号更加清晰可靠。
对交易费用进行优化。现有策略没有考虑手续费的影响,可以结合真实交易账户,对开仓数目大小进行优化。
调整止损模型。现有的止损方式较为简单,无法完美契合市场变化。可以测试移动止损,追踪止损等方式。
测试不同品种的应用效果。目前仅在标普和纳指这两个指数上测试。可以扩大样本区间,找到最匹配该策略品种。
总结
本策略综合利用EMA、VWAP和RSI三个指标的优势,实现了趋势追踪和超买超卖的有效组合,能够在大周期向上和短期调整中均能找到合理的入场时机,并具有较强的稳定性。同时,策略优化空间较大,有望通过引入更多指标、调整止损方式等手段进一步提高策略胜率和盈利水平。
/*backtest
start: 2024-01-15 00:00:00
end: 2024-01-22 00:00:00
period: 1m
basePeriod: 1m
exchanges: [{"eid":"Futures_Binance","currency":"BTC_USDT"}]
*/

// This source code is subject to the terms of the Mozilla Public License 2.0 at https://mozilla.org/MPL/2.0/
// © mohanee

//@version=4
strategy(title="VWAP and RSI strategy [EEMANI]", overlay=false)
//This strategy combines VWAP and RSI indicators
//BUY RULE
//1. EMA50 > EMA 200
//2. if current close > vwap session  value and  close>open
//3. check if RSI3 is dipped below 10  for any of last 10 candles
//EXIT RULE
//1. RSI3   crossing down 90 level
//STOP LOSS EXIT
//1. As configured --- default is set to 5%


// variables  BEGIN

longEMA = input(200, title="Long EMA", minval=1)
shortEMA = input(50, title="short EMA", minval=1)

rsi1 = input(3,title="RSI Period", minval=1)
rsi_buy_line = input(10,title="RSI Buy Line", minval=5)
rsi_sell_line = input(90,title="RSI Sell Line", minval=50)

stopLoss = input(title="Stop Loss%", defval=5, minval=1)

//variables  END


longEMAval= ema(close, longEMA)
shortEMAval= ema(close, shortEMA)
rsiVal=rsi(close,rsi1)
vwapVal=vwap(hlc3)


// Drawings

plot_rsi = plot(rsiVal, title="RSI", color=color.purple, linewidth=1)
//plot_fill = plot(0, color=color.green, editable=false)
//fill(plot_rsi, plot_fill, title="Oscillator Fill", color=color.blue, transp=75)
hline(rsi_buy_line, color=color.green, title="Buy Line", linewidth=2, linestyle=hline.style_dashed)
hline(rsi_sell_line, color=color.purple, title="Sell Line", linewidth=2, linestyle=hline.style_dashed)
//plot(value_ma, title="MA", color=color_ma, linewidth=2)

longCondition=  shortEMAval > longEMAval and  close>open and  close>vwapVal
rsiDipped =  rsiVal[1]<rsi_buy_line or rsiVal[2]<rsi_buy_line or rsiVal[3]<rsi_buy_line  or rsiVal[4]<rsi_buy_line  or rsiVal[5]<rsi_buy_line  or rsiVal[6]<rsi_buy_line or rsiVal[7]<rsi_buy_line  or rsiVal[8]<rsi_buy_line  or rsiVal[9]<rsi_buy_line  or rsiVal[10]<rsi_buy_line

//Entry
strategy.entry(id="VWAP_RSI LE", comment="VR LE" , long=true,  when= longCondition and rsiDipped )

//Take profit Exit
strategy.close(id="VWAP_RSI LE", comment="TP Exit",   when=crossunder(rsiVal,90) )


//stoploss
stopLossVal =   strategy.position_avg_price -  (strategy.position_avg_price*stopLoss*0.01)
strategy.close(id="VWAP_RSI LE", comment="SL Exit",   when= close < stopLossVal)