概述
该策略首先通过计算一定周期内的最高价和最低价的差除以最高价来得到威廉VIX指标。然后结合布林带的标准差原理,设定上轨和下轨。同时结合一定周期内的百分位设置止盈范围。在 entry 部分,当价格从上轨下穿且低于 DEMA 指标时做多;当价格从下轨上穿且高于 DEMA 指标时做空。
策略原理
该策略主要利用了威廉VIX指标判断市场波动性和风险的同时,辅以 DEMA 指标判断价格趋势。
首先,威廉VIX指标的计算公式为:
WVF = ((Highest(close, n) - Low) / (Highest(close, n))) * 100
其中 n 为参数周期数。该指标反映了在一定周期内最高价和最低价之间的波动性。数值越高表示波动性越大,风险越高。
在此基础上,该策略运用了布林带的思想。设定上轨为中轨+n倍标准差,下轨为中轨-n倍标准差。当价格接近上轨时,表示波动性扩大,做多机会;当价格接近下轨时,表示波动性收缩,做空机会。
此外,该策略还设置了基于一定周期内的百分位原理的止盈范围。比如90分位,就是统计周期内最近90%的价格。当价格超过该分位时,表示波动已经比较大,可以考虑止盈了。
在具体的交易策略中,结合了 DEMA 指标判断趋势。只有当价格从上轨下穿且低于 DEMA 时才做多;只有当价格从下轨上穿且高于 DEMA 时才做空。
策略优势分析
该策略结合了判断波动性的威廉VIX指标、基于标准差原理的布林带以及判断趋势的 DEMA 指标,综合性很强,可以较好地把握市场的两大要素:风险和趋势。
具体来说,威廉VIX指标和布林带上下轨组合,可以对波动性风险进行判断;DEMA指标可以判断价格趋势方向;止盈范围设置可以锁定盈利,拒绝过度贪婪。
所以该策略在把握风险和趋势两方面都做得很好,不仅可以选择较好的入场时机,也可以通过止盈范围来避免已经得到较好利润时的反转风险,可以说是稳重保守型的策略。
策略风险分析
该策略最大的风险在于波动性指标和趋势指标可能会出现分歧。也就是威廉VIX指标显示波动性增大,价格接近布林带上轨或下轨时,DEMA指标的判断和其不一致。比如波动性显示做多机会,但是 DEMA 显示下跌趋势。这时就可能产生亏损。
此外,止盈范围设置的过于保守也会影响策略的盈利能力。如果分位参数设置的太低,很难触发止盈,从而无法锁定盈利。
优化方向
可以考虑将止盈范围参数设置成可调的参数,在不同的市场环境中可以做出调整。具体来说,在震荡行情时,可以适当提高分位参数,扩大止盈范围;但在趋势明显的行情中,应降低分位参数,及时止盈。
另外,也可以考虑添加其他判断趋势的指标,当原有的 DEMA 指标和新增指标不一致时,暂缓建仓,避免假信号带来的亏损。
总结
该策略综合运用了波动性指标、标准差原理、趋势判断和止盈思想,可以很好地应对市场的风险和趋势变化。它稳重保守,适合长线持有。通过参数优化,可以进一步增强策略的稳定性和盈利能力。
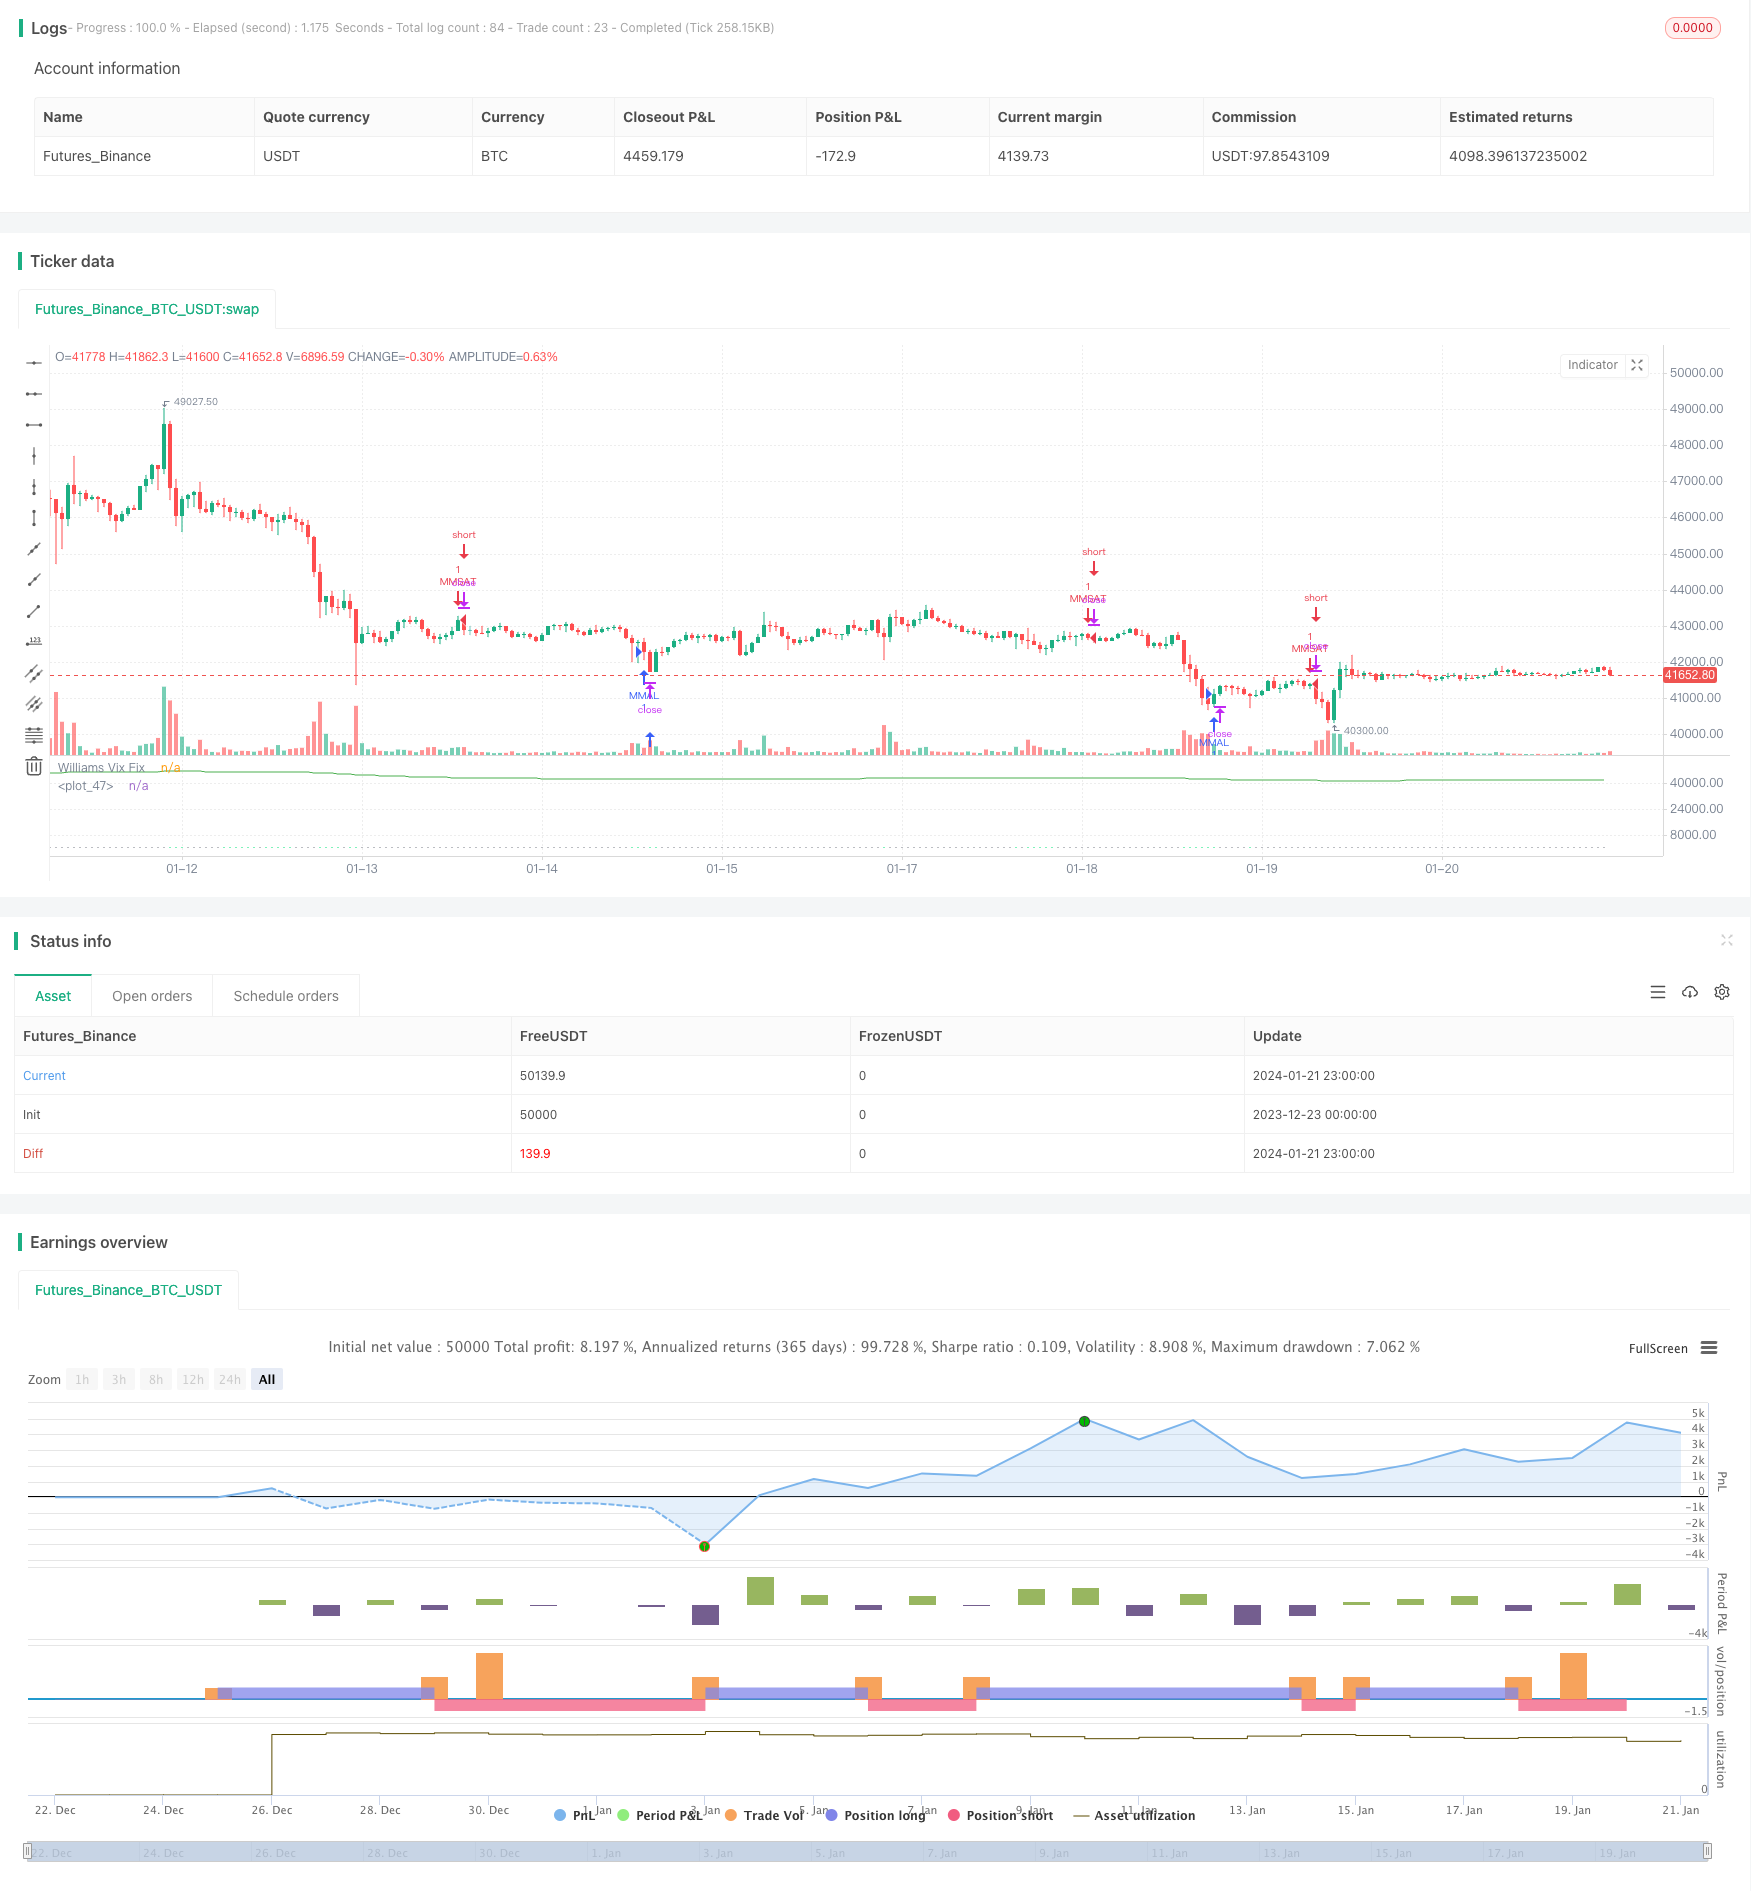
/*backtest
start: 2023-12-23 00:00:00
end: 2024-01-22 00:00:00
period: 1h
basePeriod: 15m
exchanges: [{"eid":"Futures_Binance","currency":"BTC_USDT"}]
*/

//@version=2

strategy("VIX and DEMA", overlay=false)
pd = input(22, title="LookBack Period Standard Deviation High")
bbl = input(20, title="Bolinger Band Length")
multupper = input(2.0    , minval=1, maxval=5, title="Bollinger Band Standard Devaition Up")
multlow = input(2.0,minval=1,maxval=5,title="BB STD LOW")
lb = input(50  , title="Look Back Period Percentile High")
ph = input(.85, title="Highest Percentile - 0.90=90%, 0.95=95%, 0.99=99%")
pl = input(1.01, title="Lowest Percentile - 1.10=90%, 1.05=95%, 1.01=99%")
hp = input(false, title="Show High Range - Based on Percentile and LookBack Period?")
sd = input(false, title="Show Standard Deviation Line?")

wvf = ((highest(close, pd)-low)/(highest(close, pd)))*100

sDevupper = multupper * stdev(wvf, bbl)
sDevlow = multlow *stdev(wvf,bbl)
midLine = sma(wvf, bbl)
lowerBand = midLine - sDevlow
upperBand = midLine + sDevupper

rangeHigh = (highest(wvf, lb)) * ph
rangeLow = (lowest(wvf, lb)) * pl

col = wvf >= upperBand or wvf >= rangeHigh ? lime : gray
price=close


plot(hp and rangeHigh ? rangeHigh : na, title="Range High Percentile", style=line, linewidth=4, color=orange)
plot(hp and rangeLow ? rangeLow : na, title="Range High Percentile", style=line, linewidth=4, color=orange)
plot(wvf, title="Williams Vix Fix", style=histogram, linewidth = 4, color=col)
plot(sd and upperBand ? upperBand : na, title="Upper Band", style=line, linewidth = 3, color=aqua)

yearfrom = input(2018)
yearuntil =input(2019)
monthfrom =input(1)
monthuntil =input(12)
dayfrom=input(1)
dayuntil=input(31)


lengthema = input(50, minval=1)
src = input(close, title="Source")
e1 = ema(src, lengthema)
e2 = ema(e1, lengthema)
dema = 2 * e1 - e2
plot(dema, color=green)


if ((crossunder(wvf,upperBand) ) and (price<dema) )
    strategy.entry("MMAL", strategy.long, stop=close, oca_name="TREND",  comment="AL")

else
    strategy.cancel(id="MMAL")


if   ((( (wvf<lowerBand) ) and  (price>dema) ) )

    strategy.entry("MMSAT", strategy.short,stop=close, oca_name="TREND",  comment="SAT")
else
    strategy.cancel(id="MMSAT")