资源加载中... loading...

Oscillation Breakthrough Strategy Based on Moving Average

Author: ChaoZhang, Date: 2024-01-23 15:13:31
Tags:

img

Overview

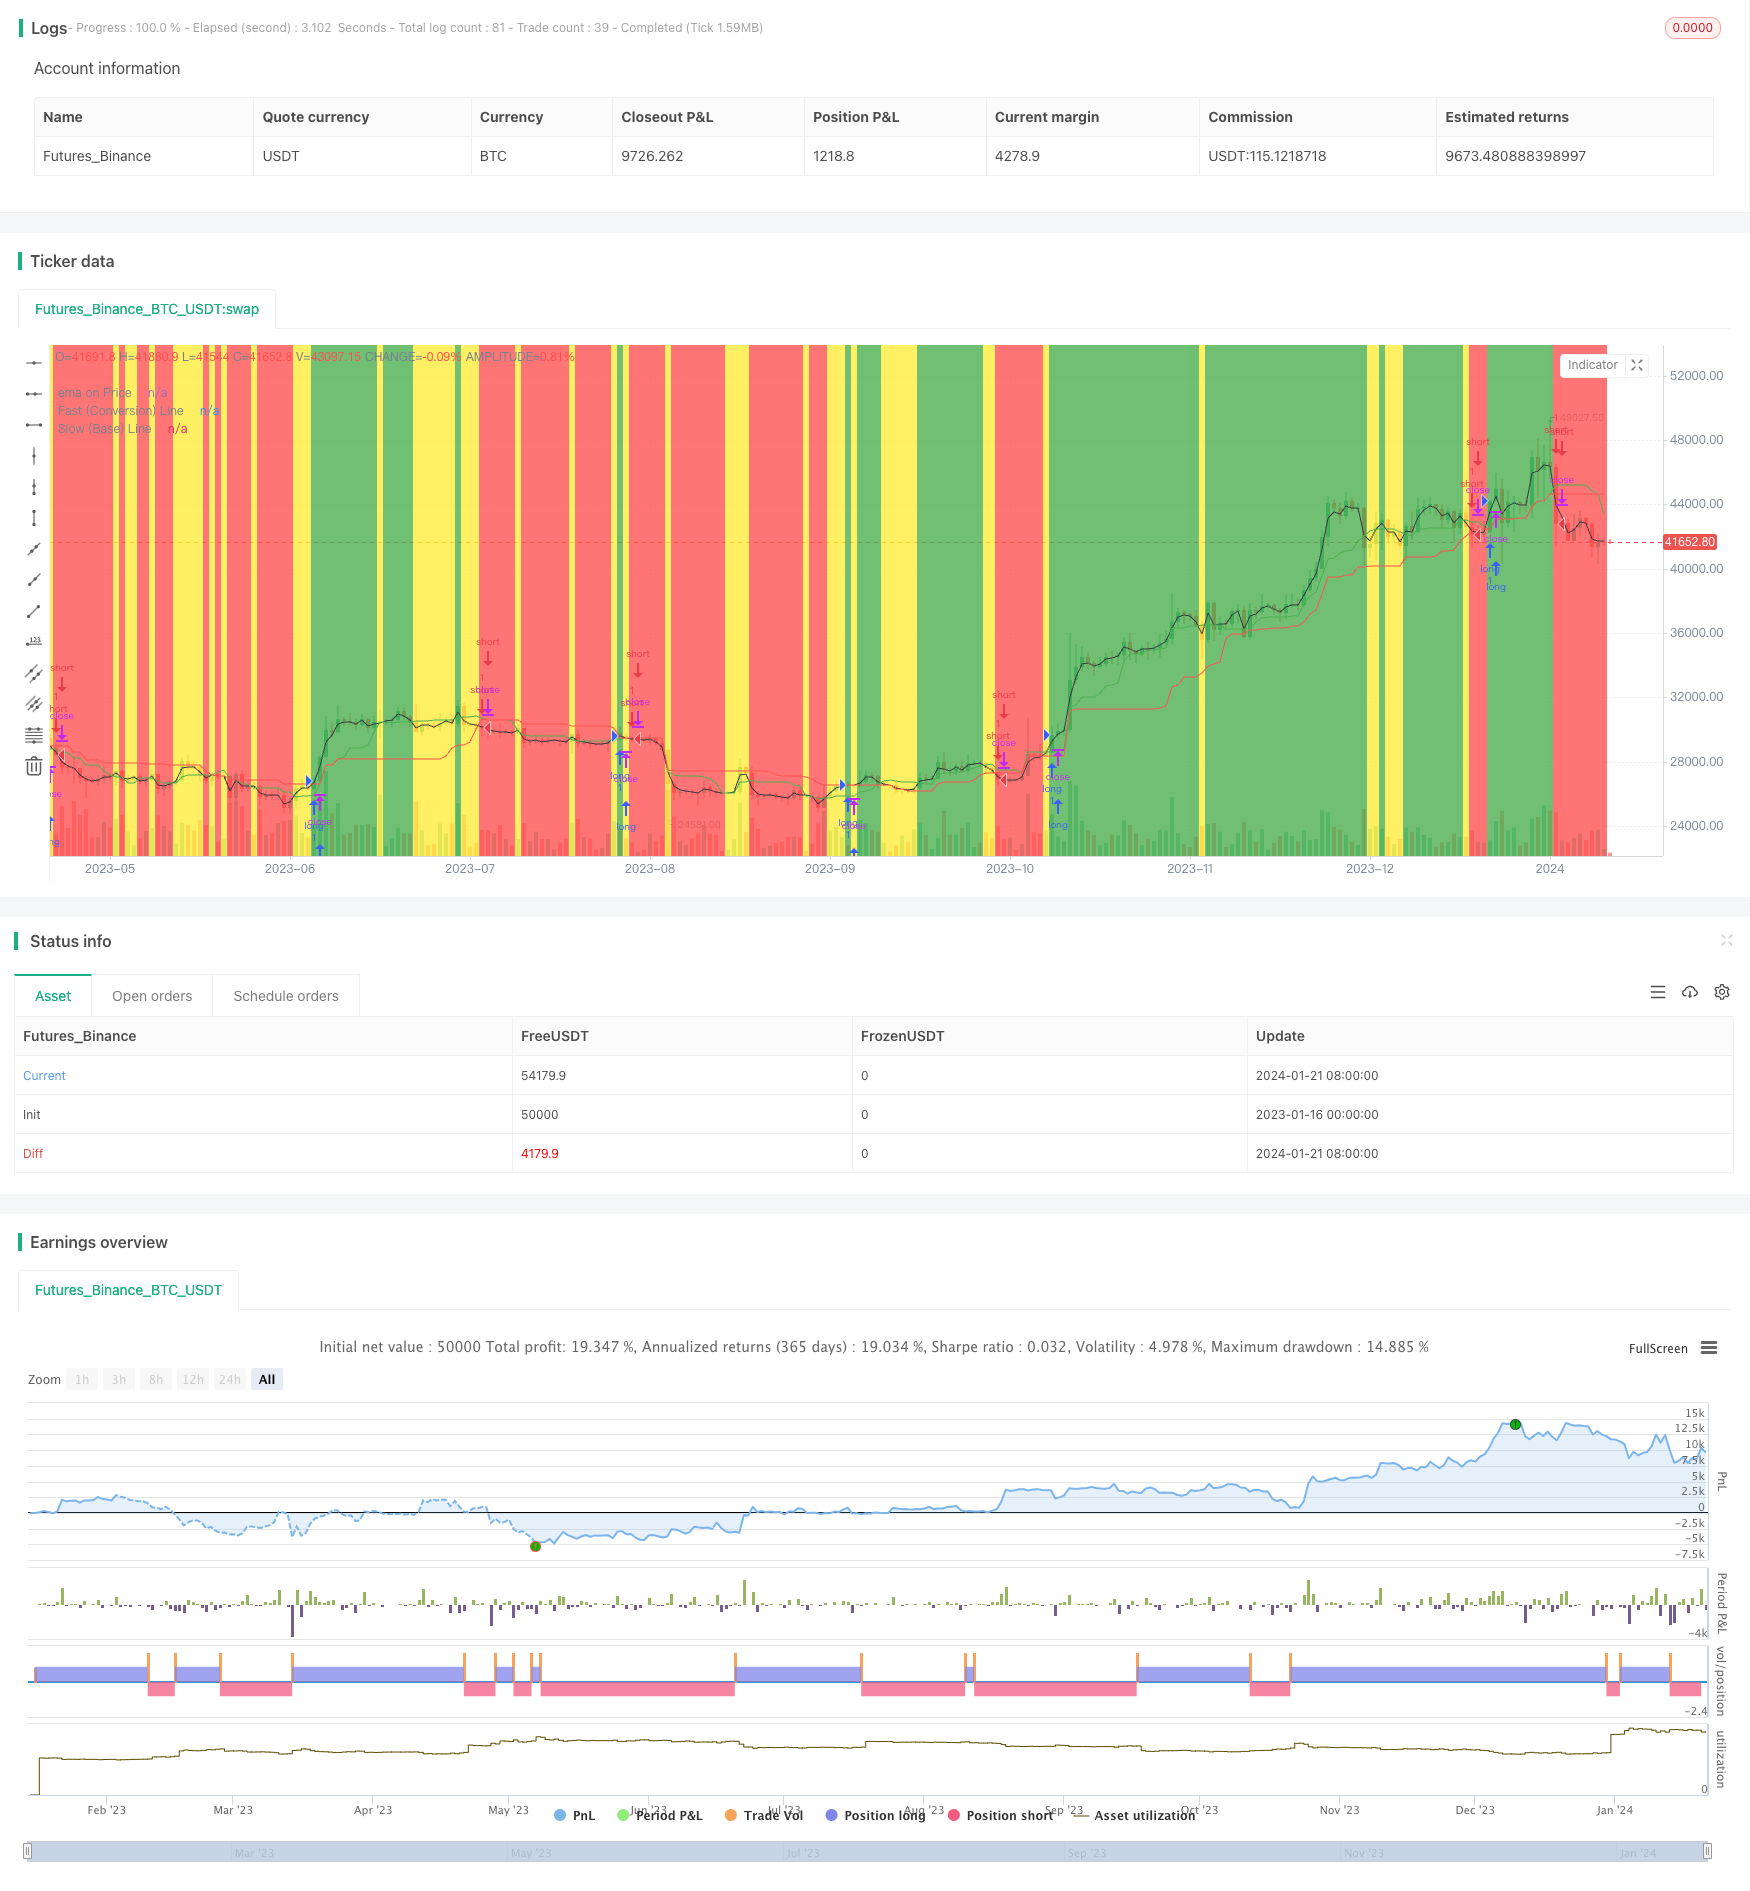
The strategy is named “Oscillation Breakthrough Strategy Based on Moving Average”. It calculates moving average lines of different cycles of prices to determine whether prices break through key moving averages for long and short trading. When the short-term moving average breaks through the long-term moving average, go long. When the short-term moving average falls through the long-term moving average, go short.

Strategy Principle

The strategy is mainly based on the theory of moving averages. The moving average is a commonly used analytical tool in technical analysis. It smooths price data by filtering out short-term price fluctuations “noise” and reflects the main trend direction of prices. The fast moving average reflects short-term price trends, while the slow moving average reflects long-term price trends. When the fast moving average crosses above or falls below the slow moving average, it means that the short-term trend reverses the long-term trend, which often signals a price reversal.

This strategy utilizes this principle by setting two EMA averages with different parameters, a short-term one as the fast line and a long-term one as the slow line. The strategy sets EMAs with lengths of 9 and 26 to calculate the conversion line and baseline. When the short-term EMA crosses above the long-term EMA, go long, indicating the short-term price is higher than the long-term price, a bullish signal. When the short-term EMA crosses below the long-term EMA, go short, indicating the short-term price is lower than the long-term price, a bearish signal.

Thus, this strategy judges possible reversal points of prices through breakthroughs of fast and slow EMAs in order to capture short-term trend opportunities of prices.

Analysis of Advantages

  • Use reliable indicators based on moving average theory to determine price reversal points
  • Simple to understand and implement based on basic indicators
  • Flexible parameters for tuning and optimization for different products
  • Option to only open positions during specific trading hours to avoid overnight risks
  • Look for clearer breakthrough points to increase win rate

Analysis of Risks and Solutions

  • Prone to multiple small losses from back and forth trading
    Can appropriately loosen stop loss range, wait for clear reversal signal before entering positions

  • For low liquidity stocks, price gaps or inconsistent prices can occur Parameters can be optimized, adjust moving average cycle parameters, trade with optimized parameters

  • Easy to get false signals in sideways choppy markets Can combine with other indicators for confirmation before entering positions

  • Limited ability to handle complex market situations with just simple moving average indicators Can introduce other technical indicators for improved decision making at key points

Optimization Directions

This strategy can also be further optimized in the following aspects:

  1. Add position sizing mechanism to control position risk with adding/reducing

  2. Add stop loss mechanism to effectively control per trade loss

  3. Incorporate trading volume, volume indicators to avoid false price breakouts

  4. Add model prediction, use machine learning etc to predict probability of price reversal, improve decisions

  5. Utilize deep learning to simulate professional trader decision making logic and select signals at high reversal probability points

Summary

This is a short-term mean reversion strategy based on moving average indicators. The customizable parameters provide good flexibility. Although using simple indicators, it can be adapted well to market environments through parameter tuning. The strategy aims to capture arbitrage opportunities from short-term price reversals. By introducing mechanisms like position sizing, stop loss etc, risks can be effectively managed to improve stability. More advanced technical indicators and machine learning methods can also be used to explore performance improvement.


/*backtest
start: 2023-01-16 00:00:00
end: 2024-01-22 00:00:00
period: 1d
basePeriod: 1h
exchanges: [{"eid":"Futures_Binance","currency":"BTC_USDT"}]
*/

//@version=3
strategy("Juiced Ichimoku Strat", overlay=true)

USE_TRADESESSION = input(title='Use Trading Session?', type=bool, defval=true)
trade_session = input(title='Trade Session:', defval='0800-1600', confirm=false)
istradingsession = not USE_TRADESESSION ? false : not na(time('1', trade_session))
bgcolor(istradingsession?gray:na)

varLo = input(title="Fast (Conversion) Line",  defval=9, minval=1, maxval=99999)
varHi = input(title="Slow (Base) Line",  defval=26, minval=1, maxval=99999)
emafreq = input(title="Ema on price frequency",  defval=2, minval=1, maxval=99999)

a = lowest(varLo)
b = highest(varLo)
c = (a + b ) / 2

d = lowest(varHi)
e = highest(varHi)
f = (d + e) / 2

//g = ((c + f) / 2)[varHi]
//h = ((highest(varHi * 2) + lowest(varHi * 2)) / 2)[varHi]

z = ema(close, emafreq)

bgcolor(z > c and z > f ? green : z < c and z < f ? red : yellow, transp=70)
plot(z, title="ema on Price", color=black)
plot(c, title="Fast (Conversion) Line", color=green)
plot(f, title="Slow (Base) Line", color=red)

long = z > c and z > f and (USE_TRADESESSION ? istradingsession : true)
short = z < c and z < f and (USE_TRADESESSION ? istradingsession : true)
//exit = z < c and z > f or z > c and z < f

closelong = z < c and z > f or z > c and z < f and (USE_TRADESESSION ? istradingsession : true)
if (closelong)
    strategy.close("Long")
closeshort = z < c and z > f or z > c and z < f and (USE_TRADESESSION ? istradingsession : true)
if (closeshort)
    strategy.close("Short")
strategy.entry("long", strategy.long, when=long)
strategy.entry("short", strategy.short, when=short)


template: strategy.tpl:40:21: executing "strategy.tpl" at <.api.GetStrategyListByName>: wrong number of args for GetStrategyListByName: want 7 got 6