概述
此策略旨在识别市场中的潜在回踪机会。该策略采用双均线系统:长期移动平均线(MA1)和短期移动平均线(MA2)。主要目标是当收盘价低于MA1但高于MA2时,表明一个潜在的在大趋势中的回踪机会,从而进行做多。
策略原理
该策略使用两条移动平均线:MA1(长线)和MA2(短线)。其原理是,如果短期价格出现回落,测试长期趋势的支撑,那么这可能是一个做多的机会。具体来说,如果收盘价高于长期支撑(MA1),说明大趋势依然不错;而如果收盘价跌破短期均线(MA2)却依然站稳在长期均线(MA1)之上,那么这是一个典型的回踩机会。这时候买入并设立止损,等待价格重新回到短线上方。
优势分析
该策略具有以下优势:
- 实现简单,容易理解,参数调整灵活
- 借助双均线系统识别大趋势,避免逆势交易
- 可定制的时间过滤器,避免特定时间段的市场异常
- 可调整仓位大小,满足不同风险偏好
- 采用止损机制来限制亏损风险
风险分析
该策略也存在以下风险:
- 回踩失败,价格继续下跌,无法止损
- 大趋势发生转折,原来支撑位被打破
- 市场出现剧烈波动,移动平均线发生背离
- 时间段选择不当,错过交易机会
对应地,可以从以下几个方面来优化和改进:
- 优化移动平均线参数,改进交易信号质量
- 优化止损水平,在最大限度减少风险的前提下获取利润
- 调整时间过滤器,定位到最佳交易时段
- 测试不同品种和市场环境
优化方向
该策略可从以下几个方面进行优化:
- 优化移动平均线参数,寻找最佳参数组合
- 测试不同的止损机制,如追踪止损、振荡止损等
- 增加其他过滤器,如交易量过滤、波动率过滤等
- 增加仓位管理机制,如金叉加仓、死叉减仓
- 增加自动止盈机制
- 进行回测并计算关键指标,确定最佳参数
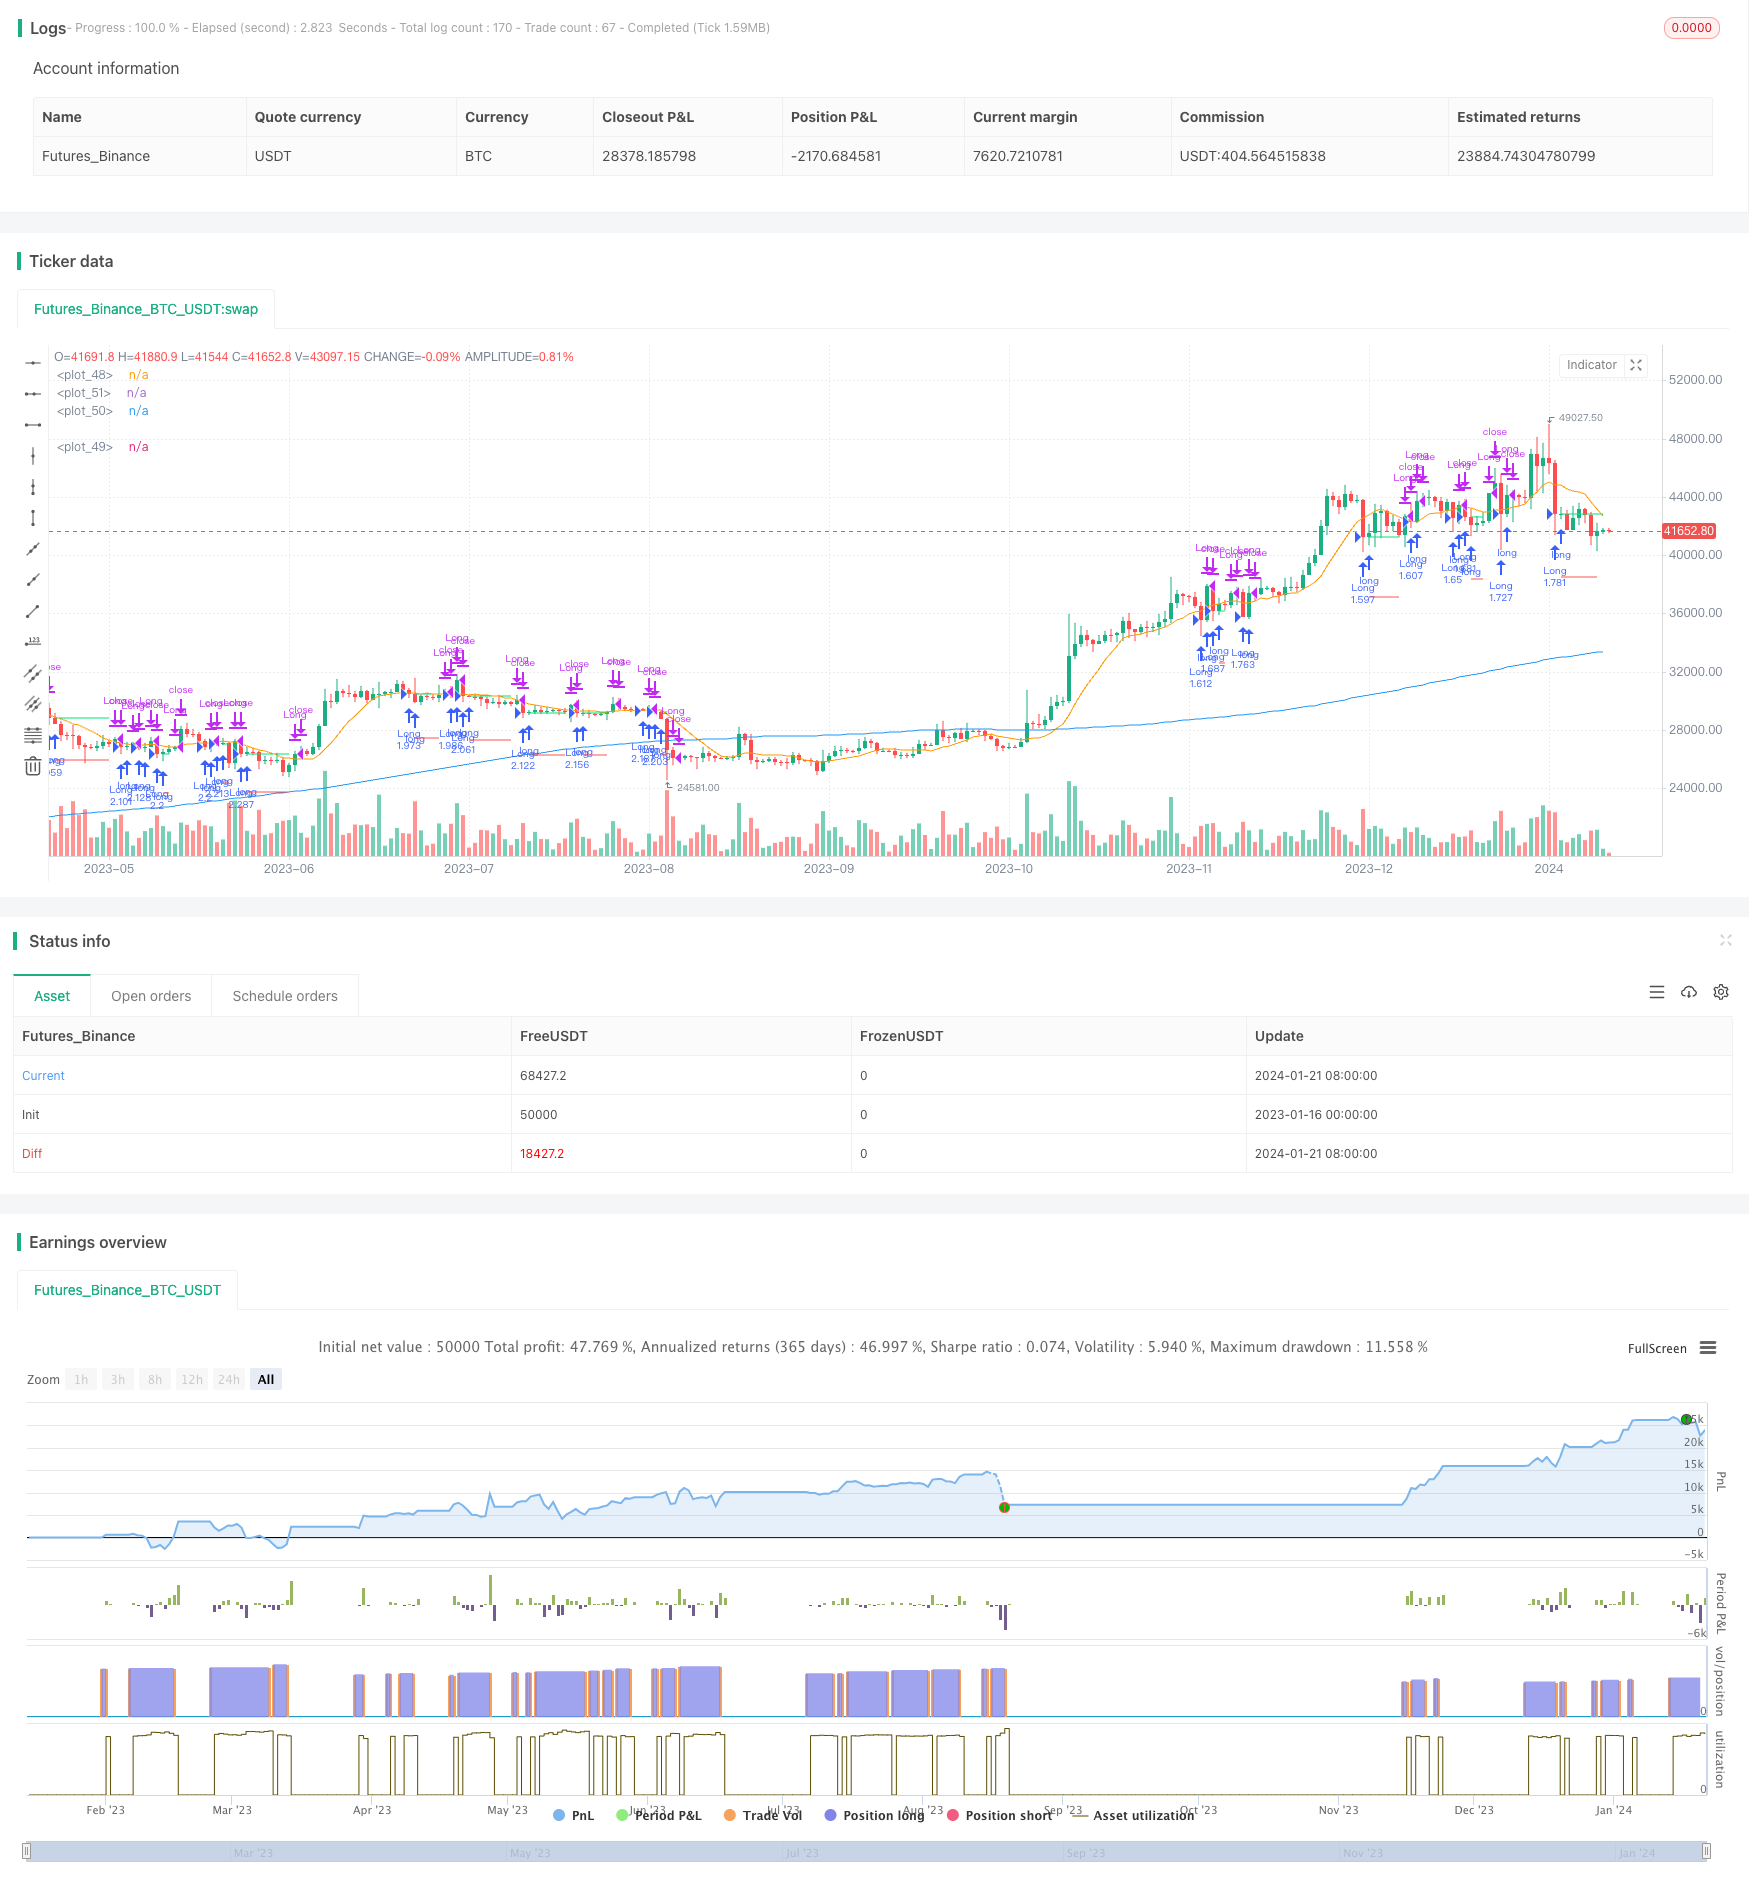
总结
本策略总的来说是一个简单实用的短线拉回策略。它使用双均线识别回踩机会,并设立移动止损来控制风险。该策略容易理解和实现,参数调整灵活,可满足不同风险偏好。下一步,可以从优化移动平均线参数、止损机制、过滤器等多个角度进行改进,使策略更加稳健。
策略源码
/*backtest
start: 2023-01-16 00:00:00
end: 2024-01-22 00:00:00
period: 1d
basePeriod: 1h
exchanges: [{"eid":"Futures_Binance","currency":"BTC_USDT"}]
*/

// This source code is subject to the terms of the Mozilla Public License 2.0 at https://mozilla.org/MPL/2.0/
// © ZenAndTheArtOfTrading / www.PineScriptMastery.com
// @version=5
strategy("Simple Pullback Strategy",
     overlay=true,
     initial_capital=50000,
     default_qty_type=strategy.percent_of_equity,
     default_qty_value=100, // 100% of balance invested on each trade
     commission_type=strategy.commission.cash_per_contract,
     commission_value=0.005) // Interactive Brokers rate

// Get user input
i_ma1           = input.int(title="MA 1 Length", defval=200, step=10, group="Strategy Parameters", tooltip="Long-term MA")
i_ma2           = input.int(title="MA 2 Length", defval=10, step=10, group="Strategy Parameters", tooltip="Short-term MA")
i_stopPercent   = input.float(title="Stop Loss Percent", defval=0.10, step=0.1, group="Strategy Parameters", tooltip="Failsafe Stop Loss Percent Decline")
i_lowerClose    = input.bool(title="Exit On Lower Close", defval=false, group="Strategy Parameters", tooltip="Wait for a lower-close before exiting above MA2")
i_startTime     = input(title="Start Filter", defval=timestamp("01 Jan 1995 13:30 +0000"), group="Time Filter", tooltip="Start date & time to begin searching for setups")
i_endTime       = input(title="End Filter", defval=timestamp("1 Jan 2099 19:30 +0000"), group="Time Filter", tooltip="End date & time to stop searching for setups")

// Get indicator values
ma1 = ta.sma(close, i_ma1)
ma2 = ta.sma(close, i_ma2)

// Check filter(s)
f_dateFilter =true

// Check buy/sell conditions
var float buyPrice = 0
buyCondition    = close > ma1 and close < ma2 and strategy.position_size == 0 and f_dateFilter
sellCondition   = close > ma2 and strategy.position_size > 0 and (not i_lowerClose or close < low[1])
stopDistance    = strategy.position_size > 0 ? ((buyPrice - close) / close) : na
stopPrice       = strategy.position_size > 0 ? buyPrice - (buyPrice * i_stopPercent) : na
stopCondition   = strategy.position_size > 0 and stopDistance > i_stopPercent

// Enter positions
if buyCondition
    strategy.entry(id="Long", direction=strategy.long)

if buyCondition[1]
    buyPrice := open

// Exit positions
if sellCondition or stopCondition
    strategy.close(id="Long", comment="Exit" + (stopCondition ? "SL=true" : ""))
    buyPrice := na

// Draw pretty colors
plot(buyPrice, color=color.lime, style=plot.style_linebr)
plot(stopPrice, color=color.red, style=plot.style_linebr, offset=-1)
plot(ma1, color=color.blue)
plot(ma2, color=color.orange)