概述
双跳空策略是一种用于比特币和黄金短线交易的量化策略。它结合使用了移动平均线、布林带和ATR止损来识别突破信号并管理风险。
策略原理
双跳空策略使用快速EMA和慢速EMA的交叉来判断趋势方向。当快速EMA向上突破慢速EMA时生成买入信号;当快速EMA向下突破慢速EMA时生成卖出信号。为了避免假突破,策略要求突破信号必须发生在布林带上轨或中轨附近,这就是“双跳空”的由来。
具体来说,在判断买入信号时,需要满足以下两个条件:1)快速EMA上穿慢速EMA;2)收盘价接近或低于布林带上轨或中轨。判断卖出信号也是类似,需要快速EMA下穿慢速EMA并且接近布林带下轨或中轨。
此外,双跳空策略还使用ATR指标计算动态止损,以控制单笔交易的风险。具体的止损位置为最近两根K线的最低点再减去N倍ATR。
策略优势
- 利用双重过滤条件识别高概率突破信号
- 快速EMA crossover判断主要趋势,布林带过滤假突破
- 动态ATR止损有效控制单笔交易风险
- 适合比特币等高波动标的的短线交易
策略风险
- 快速EMA和慢速EMA参数设置不当可能产生大量假信号
- 布林带参数不当也会使过滤效果大打折扣
- 止损位置设定过tight可能增加止损被触发概率
- 短线交易需要较高的交易频次,不适合资金量小的投资者
策略优化
双跳空策略可以从以下几个方面进行优化:
- 优化移动平均线的参数,寻找最佳的快慢EMA长度组合
- 优化布林带参数,降低假突破率
- 根据不同交易品种和市场环境调整ATR止损的倍数
- 增加重新进入信号,即在止损退出后再次进入
- 结合其它指标作为辅助,例如RSI,KD等
总结
双跳空策略同时利用趋势跟踪和突破过滤,可有效识别短线机会。结合动态止损管理风险,非常适合波动率较大的数字货币和贵金属品种的短线交易。通过参数优化和规则优化,可以进一步提高策略的稳定性和盈利能力。
策略源码
/*backtest
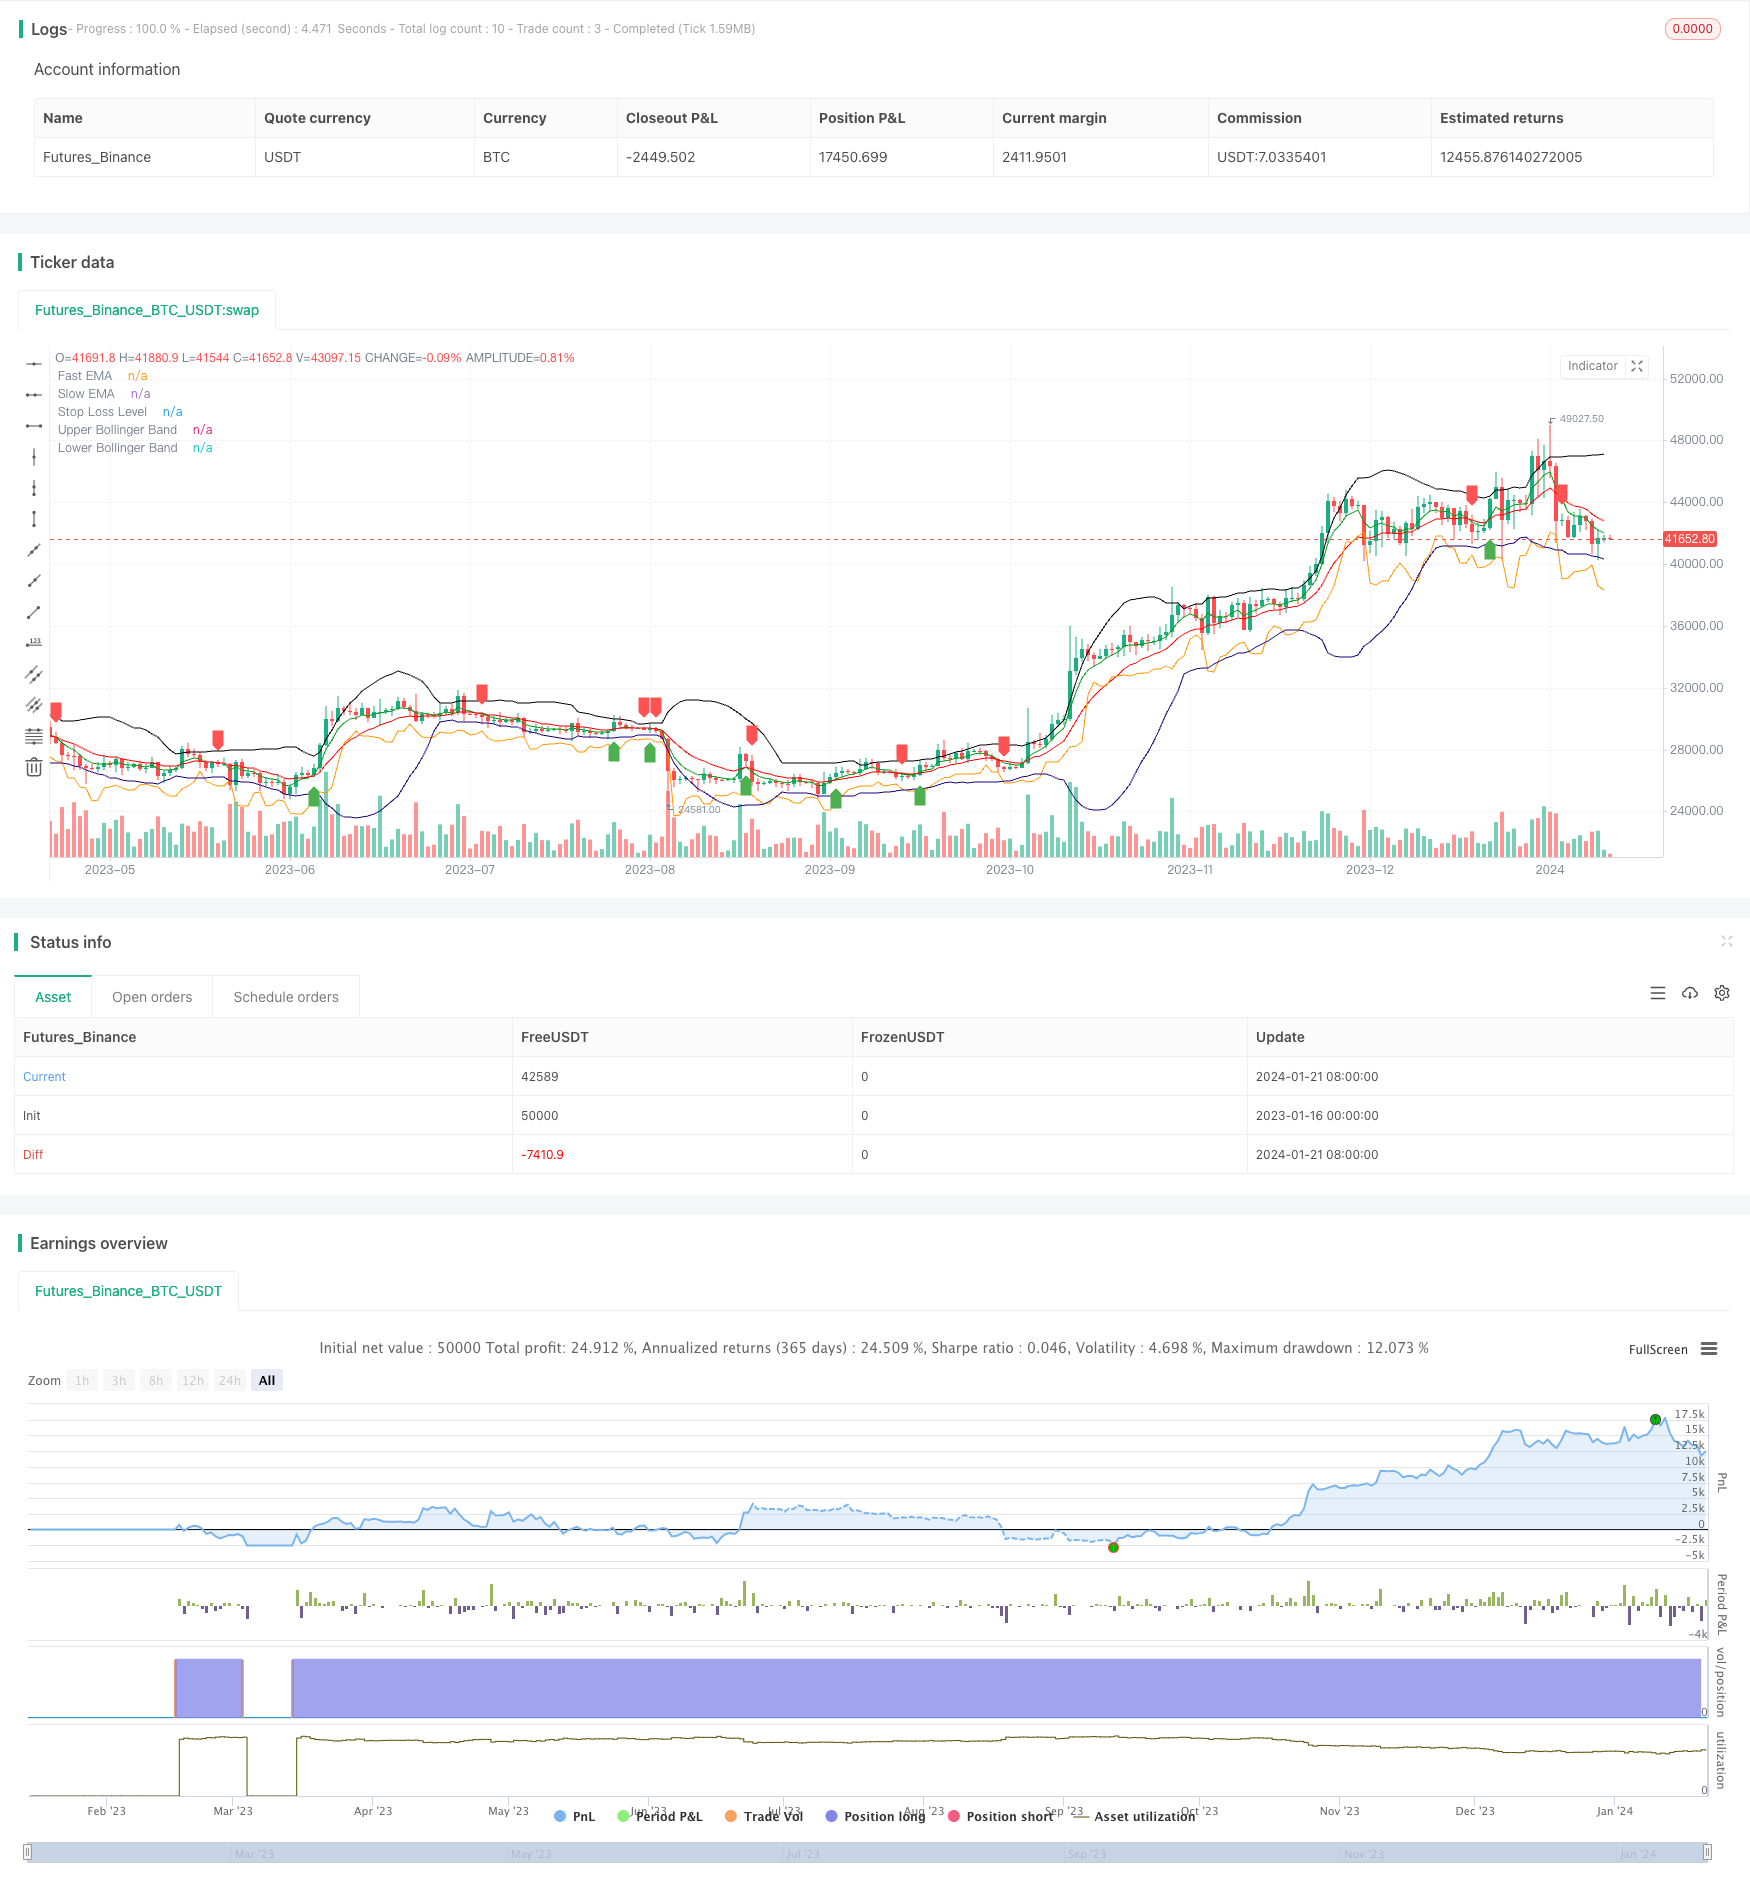
start: 2023-01-16 00:00:00
end: 2024-01-22 00:00:00
period: 1d
basePeriod: 1h
exchanges: [{"eid":"Futures_Binance","currency":"BTC_USDT"}]
*/
// This source code is subject to the terms of the Mozilla Public License 2.0 at https://mozilla.org/MPL/2.0/
// © singhak8757
//@version=5
strategy("Bitcoin and Gold 5min Scalping Strategy2.0", overlay=true)
// Input parameters
fastLength = input(5, title="Fast EMA Length")
slowLength = input(13, title="Slow EMA Length")
bollingerLength = input(20, title="Bollinger Band Length")
bollingerMultiplier = input(2, title="Bollinger Band Multiplier")
stopLossMultiplier = input(1, title="Stop Loss Multiplier")
// Calculate EMAs
fastEMA = ta.ema(close, fastLength)
slowEMA = ta.ema(close, slowLength)
// Calculate Bollinger Bands
basis = ta.sma(close, bollingerLength)
upperBand = basis + bollingerMultiplier * ta.stdev(close, bollingerLength)
lowerBand = basis - bollingerMultiplier * ta.stdev(close, bollingerLength)
// Buy condition
buyCondition = ta.crossover(fastEMA, slowEMA) and (close <= upperBand or close <= basis)
// Sell condition
sellCondition = ta.crossunder(fastEMA, slowEMA) and (close >= lowerBand or close >= basis)
// Calculate stop loss level
stopLossLevel = ta.lowest(low, 2)[1] - stopLossMultiplier * ta.atr(14)
// Plot EMAs
plot(fastEMA, color=color.rgb(0, 156, 21), title="Fast EMA")
plot(slowEMA, color=color.rgb(255, 0, 0), title="Slow EMA")
// Plot Bollinger Bands
plot(upperBand, color=color.new(#000000, 0), title="Upper Bollinger Band")
plot(lowerBand, color=color.new(#1b007e, 0), title="Lower Bollinger Band")
// Plot Buy and Sell signals
plotshape(series=buyCondition, title="Buy Signal", color=color.green, style=shape.labelup, location=location.belowbar)
plotshape(series=sellCondition, title="Sell Signal", color=color.red, style=shape.labeldown, location=location.abovebar)
// Plot Stop Loss level
plot(stopLossLevel, color=color.orange, title="Stop Loss Level")
// Strategy logic
strategy.entry("Buy", strategy.long, when = buyCondition)
strategy.exit("Stop Loss/Close", from_entry="Buy", loss=stopLossLevel)
strategy.close("Sell", when = sellCondition)