概述
这是一个结合使用移动平均线、无限脉冲响应均线(IIR)和自适应线性移动平均线(ALMA)的量化策略。该策略具有多种指标组合,可以为交易者提供丰富的交易信号。
策略原理
该策略主要包含以下几个部分:
并联使用简单移动平均线(SMA)、ALMA和IIR,检测它们之间的交叉信号作为交易入场时机。
使用3条不同周期的IIR,通过计算它们之间的距离,判断价格是否处于挤压状态。挤压状态代表着波动性减小,常常预示着价格即将产生较大幅度的变动。
对IIR的斜率进行判断,当斜率上升时,为绿色,下降时为蓝色。可以直观判断IIR的走势。
计算SMA之间的距离是否在扩大,如果是,则进行特殊标记,代表“扇形”扩张,通常意味着价格进入趋势状态。
结合相对强弱指标(RSI)的超买超卖信号,补充交易信号。
通过组合运用以上几个部分,该策略能够提供比较全面和丰富的交易入场、判断和退出信号。
策略优势分析
该策略最大的优势在于指标组合全面和丰富,既考虑了趋势判断,也考虑了波动率和超买超卖状态,为交易决策提供了多维度的参考。
另一个优势是参数和指标容易调整和优化,用户可以根据自己的需要选择来启用相关指标和参数。
从风险管理的角度来说,该策略同时关注快速均线和慢速均线,能够降低因价格震荡产生的错误信号的概率。
风险分析
该策略的主要风险在于:
过于复杂,容易造成指标冲突,选择在某些参数组合下可能会导致过拟合。
采用多组均线系统,在市场剧烈变动时(如重大经济事件),还是可能出现较大的亏损。
深度回测不足,实战中可能存在一定的survivalship bias 风险。
在应用过程中,我们需要注意风险管理,适当调整仓位规模。并且在更长的时间跨度和更大的数据集上进行多次回测,确保策略的实战效果。
策略优化方向
考虑到该策略指标组合比较复杂,参数较多,后续可以从以下几个方面进行优化:
简化指标选择,去除相关性不强或者冲突的指标。
对IIR均线的选取进行优化,选取更匹配市场特征的长度。
优化快慢均线的组合,提高交叉信号的稳定性。
增加机器学习模型辅助判断,提升策略的自适应能力。
优化与全局指数的相关性,提高趋势判断的成功率。
总结
通过指标的灵活组合和优化,该策略能够比较全面地反映市场状态,为交易决策提供多维支持。但也存在一定的实战和数据过拟合风险。我们仍需要在实践中不断优化调整策略,以适应市场的变化。
/*backtest
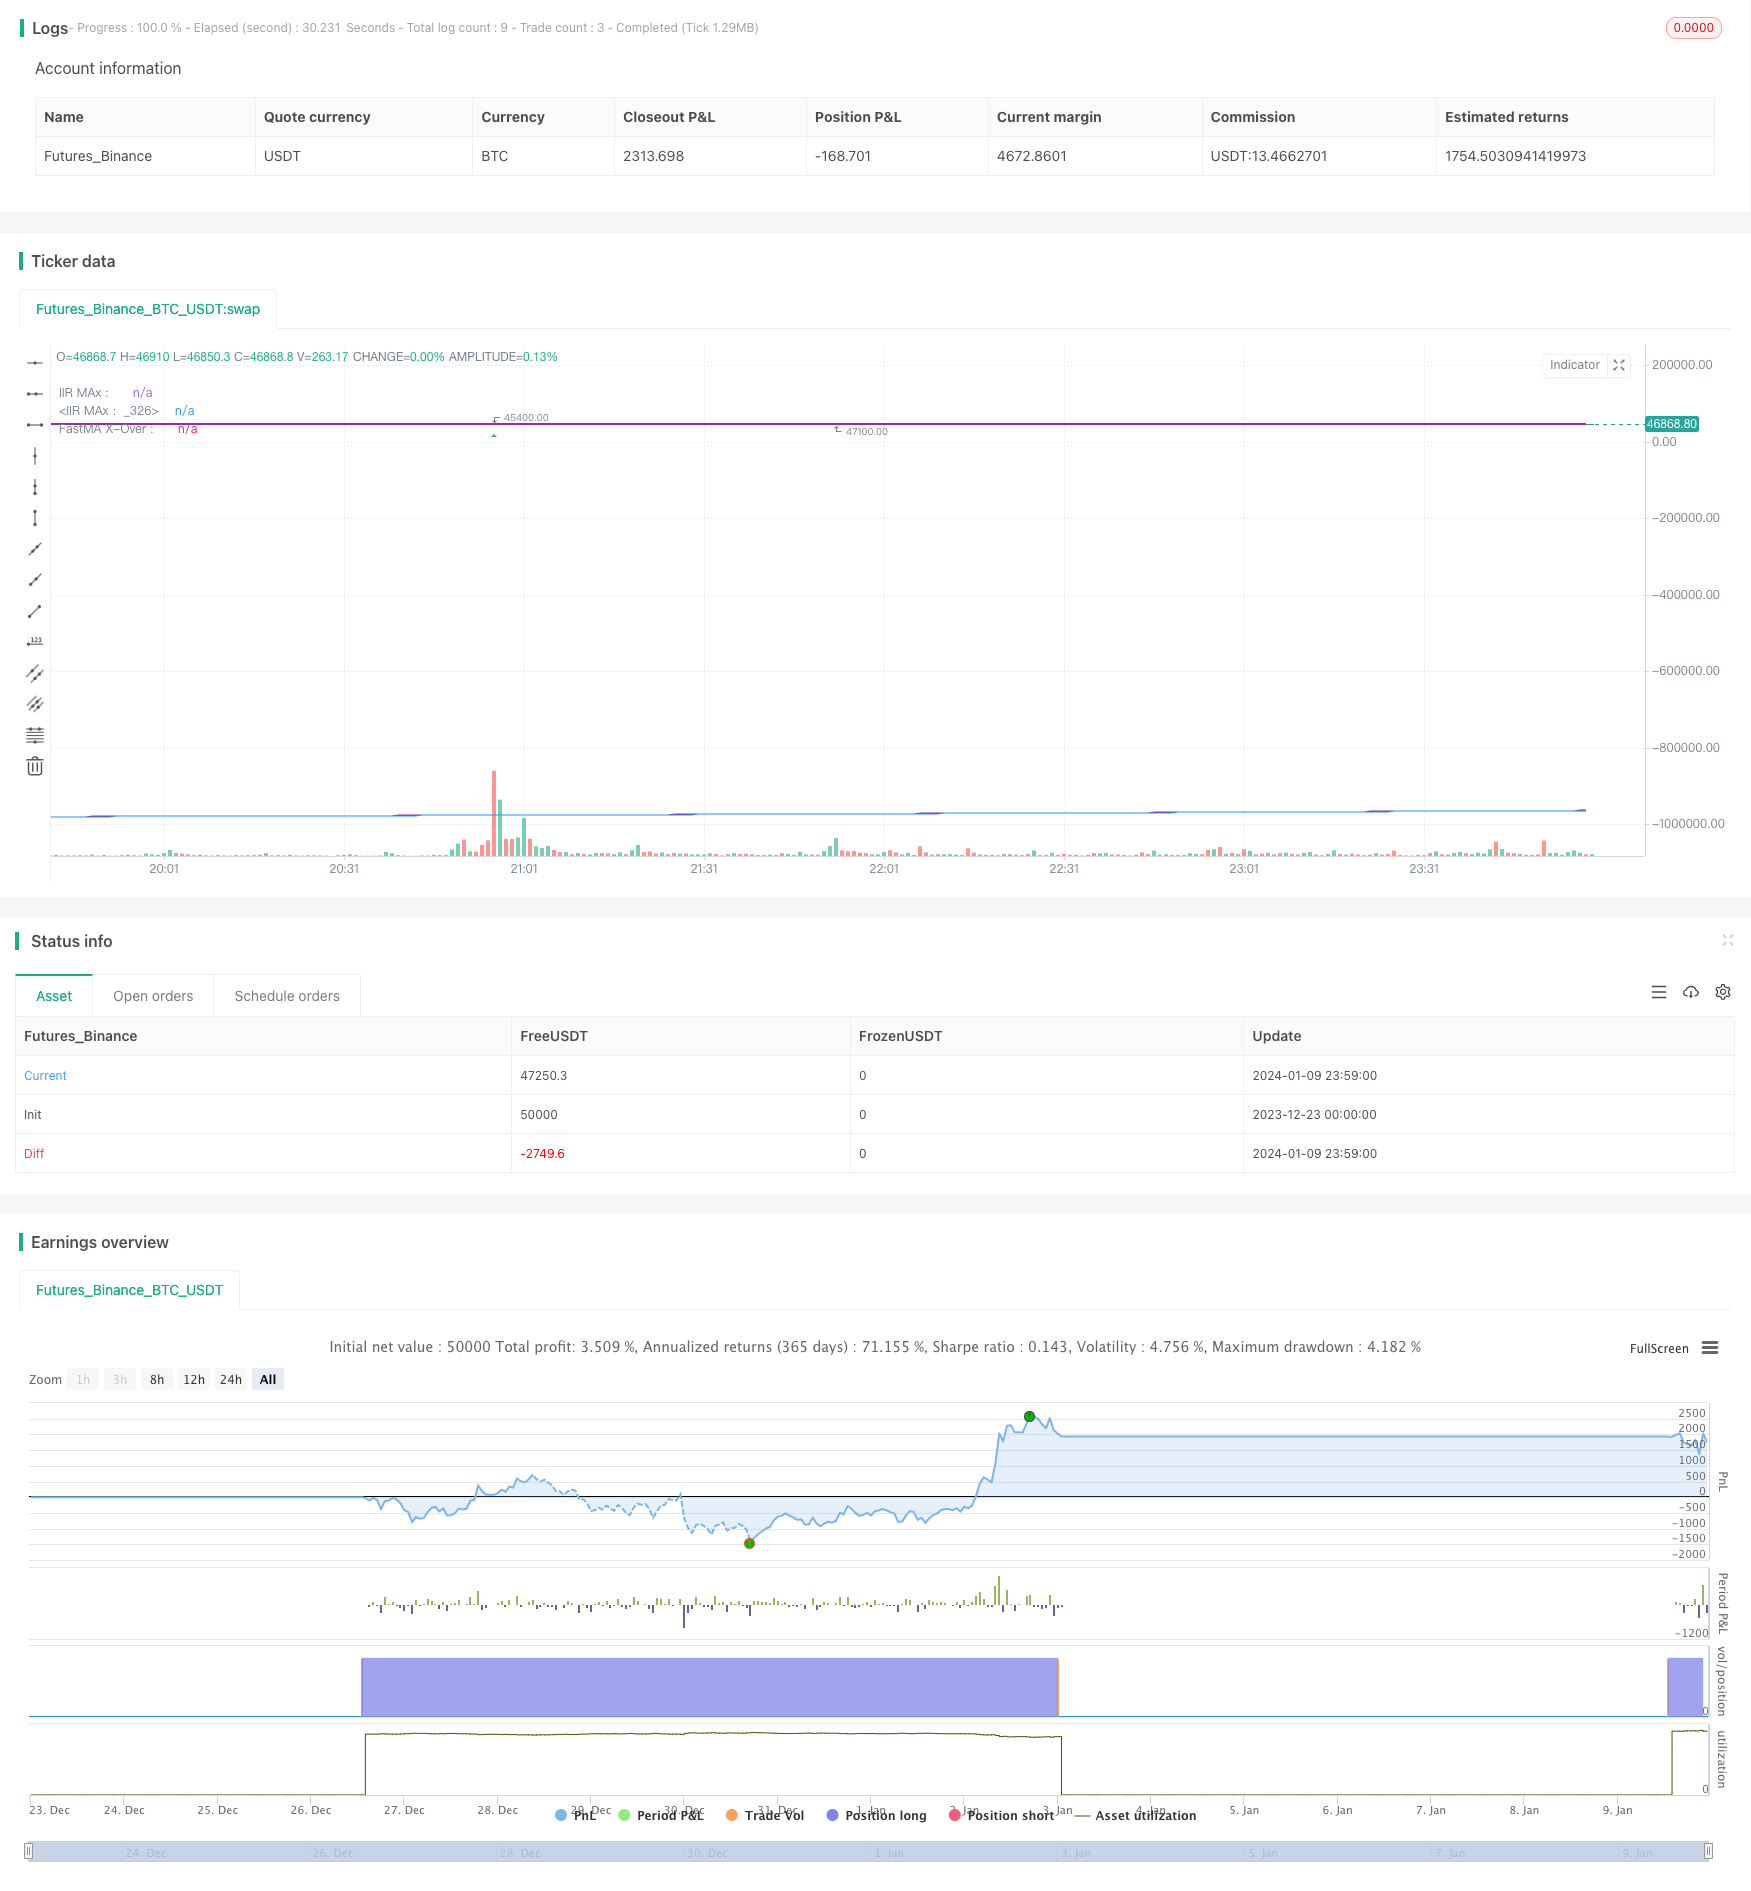
start: 2023-12-23 00:00:00
end: 2024-01-10 00:00:00
period: 1m
basePeriod: 1m
exchanges: [{"eid":"Futures_Binance","currency":"BTC_USDT"}]
*/
//The plotchar UP/DOWN Arrows is the crossover of the fastest MA and fastest IIR MAs
//
//The dots at the bottom are the two simple averages crossing over
//
//The count over/under the candles is the count of bars that the SMAs on their
//respective resolution are fanning out.
//
//The colored background indicates a squeeze, lime=kinda tight : green=very tight squeeze. based on the 3 IIRs
//
//To answer my own question in a forum, looking at the code, i couldn't figure out how to get it from another timeframe
//and run the same calculations with the same results. My answer in the end was to scale the chosen MA length
//in the corresponding CurrentPeriod/ChosenMAPeriod proportion. This results in the same line in the same place when browsing through the
//different time resolutions. Somebody might find this invaluable
//
//The counts are for MA's fanning out, or going parabolic. Theres IIRs, Almas, one done of the other. A lot.
//The arrows above and below bars are from standard RSI numbers for OB/OS
//
//The IIRs changes color depending on their slope, which can be referenced easily with a variable.
//
//The backgrond on a bar-by-bar basis is colored when 2 sets of moving averages are in a squeeze, aka
//when price is consolidating.
//
//This aims to help the trader combine conditions and entry criteria of the trade and explore these options visually.
//They detail things from all time-frames on the current one. I prefer it because of the fractal nature of price-action, both large and small,
//either yesterday or last year. For best results, go long in short-term trades when the long-term trend is also up.
//and other profitable insights. This is also a great example of an automation algorith.
//
//The pretty ribbon is my script called 'Trading With Colors'. Use them together for fanciest results. 55/233 is my Fib Cross (golden/death) Compare it to the classic 50/200 if
//you get bored. I believe it simply works better, at least for Crypto.
//
//Evidently, I am a day-trader. But this yields higher profits on larger time-frames anyways, so do play around with it. Find what works for you.
//Thanks and credit for code snippets goes to:
//matryskowal
//ChrisMoody, probably twice
//Alex Orekhov (everget)
//author=LucF and midtownsk8rguy, for PineCoders
//If you use code from this, real quick search for perhaps the original and give them a shoutout too. I may have missed something
//Author: Sean Duffy
//@version=4
strategy(title = "Combination Parabolic MA/IIR/ALMA Strategy",
shorttitle = "MA-QuickE",
overlay = true )
// calc_on_order_fills = true,
// calc_on_every_tick = true,
// Input Variables
showFIBMAs = input(false, type=input.bool, title="═══════════════ Show Fibby MAs ═══════════════")
maRes = input(960, type=input.integer, title="MA-Cross Resolution")
mal1 = input(8, type=input.integer, title="MA#1 Length")
mal2 = input(13, type=input.integer, title="MA#2 Length")
mal3 = input(34, type=input.integer, title="MA#3 Length")
loosePercentClose = input(1.1, type=input.float, title="SMA LooseSqueeze Percent")
showIIRs = input(false, type=input.bool, title="═══════════════════ Show IIRs ═══════════════════")
iirRes = input(60, type=input.integer, title="IIR Resolution")
percentClose = input(title="IIR Squeeze PercentClose", type=input.float, defval=.8)
iirlength1 = input(title="IIR Length 1", type=input.integer, defval=34)
iirlength2 = input(title="IIR Length 2", type=input.integer, defval=144)//input(title="ATR Period", type=input.integer, defval=1)
iirlength3 = input(title="IIR Length 3", type=input.integer, defval=720)//input(title="ATR Period", type=input.integer, defval=1)
showIIR1 = input(true, type=input.bool, title="Show IIR1")
showIIR2 = input(true, type=input.bool, title="Show IIR2")
showIIR3 = input(true, type=input.bool, title="Show IIR3")
showCounts = input(true, type=input.bool, title="═════════════ Show Parabolic MA Counts ════════════")
showSignals = input(true, type=input.bool, title="══════════════ Show Buy/Sell Signals ══════════════")
showBackground = input(true, type=input.bool, title="══════════════ Show Background Colors ══════════════")
//runStrategy = input(true, type=input.bool, title="══════════════ Run Strategy ══════════════")
debug = input(false, type=input.bool, title="══════════════ Show Debug ══════════════")
barLookbackPeriod = input(title="══ Bar Lookback Period ══", type=input.integer, defval=5)
percentageLookbackPeriod = input(title="══ Percentage Lookback Period ══", type=input.integer, defval=1)
bullcolor = color.green
bearcolor = color.red
color bgcolor = na
var bool slope1Green = na
var bool slope2Green = na
var bool slope3Green = na
var bool buySignal = na
var bool sellSignal = na
var bool bigbuySignal = na
var bool bigsellSignal = na
bool smbuySignal = false
bool smsellSignal = false
var bool insqueeze = na
var bool intightsqueeze = na
var bool infastsqueeze = na
var bool awaitingEntryIn = false
// My counting variables
var int count1 = 0
var float madist1 = 0
var int count2 = 0
var float madist2 = 0
var int sinceSmSignal = 0
var entryPrice = 0.0
var entryBarIndex = 0
var stopLossPrice = 0.0
// var updatedEntryPrice = 0.0
// var alertOpenPosition = false
// var alertClosePosition = false
// var label stopLossPriceLabel = na
// var line stopLossPriceLine = na
positionType = "LONG" // Strategy type, and the only current option
hasOpenPosition = strategy.opentrades != 0
hasNoOpenPosition = strategy.opentrades == 0
strategyClose() =>
if (hasOpenPosition)
if positionType == "LONG"
strategy.close("LONG", when=true)
else
strategy.close("SHORT", when=true)
strategyOpen() =>
if (hasNoOpenPosition)
if positionType == "LONG"
strategy.entry("LONG", strategy.long, when=true)
else
strategy.entry("SHORT", strategy.short, when=true)
checkEntry() =>
buysignal = false
if (hasNoOpenPosition)
strategyOpen()
buysignal := true
// if (slope1Green and (trend1Green or trend2Green) and awaitingEntryIn and hasNoOpenPosition)
// strategyOpen()
// buysignal := true
buysignal
checkExit() =>
sellsignal = false
// if (trend1Green == false and trend2Green == false) // to later have quicker exit strategy
// sellsignal := true
// strategyClose()
if (hasOpenPosition)
sellsignal := true
strategyClose()
sellsignal
multiplier(_adjRes, _adjLength) => // returns adjusted length
multiplier = _adjRes/timeframe.multiplier
round(_adjLength*multiplier)
//reset the var variables before new calculations
buySignal := false
sellSignal := false
smbuySignal := false
smsellSignal := false
bigbuySignal := false
bigsellSignal := false
ma1 = sma(close, multiplier(maRes, mal1))
ma2 = sma(close, multiplier(maRes, mal2))
ma3 = sma(close, multiplier(maRes, mal3))
madist1 := abs(ma1 - ma2)
madist2 := abs(ma1 - ma3) // check if MA's are fanning/going parabolic
if (ma1 >= ma2 and ma2 >= ma3 and madist1[0] > madist1[1]) //and abs(dataB - dataC >= madist2) // dataA must be higher than b, and distance between gaining, same with C
count1 := count1 + 1
else
count1 := 0
if (ma1 <= ma2 and ma2 <= ma3 and madist1[0] > madist1[1]) //<= madist2 and dataB <= dataC) //and abs(dataB - dataC >= madist2) // dataA must be higher than b, and distance between gaining, same with C
count2 := count2 + 1
else
count2 := 0
crossoverAB = crossover(ma1, ma2)
crossunderAB = crossunder(ma1, ma2)
plot(showFIBMAs ? ma1 : na, linewidth=3)
plot(showFIBMAs ? ma2 : na)
plot(showFIBMAs ? ma3 : na)
// Fast Squeese Check WORK IN PROGRESS
//
float singlePercent = close / 100
if max(madist1, madist2) <= singlePercent*loosePercentClose
bgcolor := color.yellow
infastsqueeze := true
else
infastsqueeze := false
// IIR MOVING AVERAGE
f(a) => a[0] // fixes mutable error
iirma(iirlength, iirsrc) =>
cf = 2*tan(2*3.14159*(1/iirlength)/2)
a0 = 8 + 8*cf + 4*pow(cf,2) + pow(cf,3)
a1 = -24 - 8*cf + 4*pow(cf,2) + 3*pow(cf,3)
a2 = 24 - 8*cf - 4*pow(cf,2) + 3*pow(cf,3)
a3 = -8 + 8*cf - 4*pow(cf,2) + pow(cf,3)
//----
c = pow(cf,3)/a0
d0 = -a1/a0
d1 = -a2/a0
d2 = -a3/a0
//----
out = 0.
out := nz(c*(iirsrc + iirsrc[3]) + 3*c*(iirsrc[1] + iirsrc[2]) + d0*out[1] + d1*out[2] + d2*out[3],iirsrc)
f(out)
iirma1 = iirma(multiplier(iirRes, iirlength1), close)
iirma2 = iirma(multiplier(iirRes, iirlength2), close)
iirma3 = iirma(multiplier(iirRes, iirlength3), close)
// adjusts length for current resolution now, length is lengthened/shortened accordingly, upholding exact placement of lines
// iirmaD1 = security(syminfo.tickerid, tostring(iirRes), iirma1, barmerge.gaps_on, barmerge.lookahead_on)
// iirmaD2 = security(syminfo.tickerid, tostring(iirRes), iirma2, barmerge.gaps_on, barmerge.lookahead_on)
// iirmaD3 = security(syminfo.tickerid, tostring(iirRes), iirma3, barmerge.gaps_on, barmerge.lookahead_on)
slope1color = slope1Green ? color.lime : color.blue
slope2color = slope2Green ? color.lime : color.blue
slope3color = slope3Green ? color.lime : color.blue
plot(showIIR1 and showIIRs ? iirma1 : na, title="IIR1", color=slope1color, linewidth=2, transp=30)
plot(showIIR2 and showIIRs ? iirma2 : na, title="IIR2", color=slope2color, linewidth=3, transp=30)
plot(showIIR3 and showIIRs ? iirma3 : na, title="IIR3", color=slope3color, linewidth=4, transp=30)
// checks slope of IIRs to create a boolean variable and and color it differently
if (iirma1[0] >= iirma1[1])
slope1Green := true
else
slope1Green := false
if (iirma2[0] >= iirma2[1])
slope2Green := true
else
slope2Green := false
if (iirma3[0] >= iirma3[1])
slope3Green := true
else
slope3Green := false
// calculate space between IIRs and then if the price jumps above both
//float singlePercent = close / 100 // = a single percent
var float distIIR1 = na
var float distIIR2 = na
distIIR1 := abs(iirma1 - iirma2)
distIIR2 := abs(iirma1 - iirma3)
if (distIIR1[0] < percentClose*singlePercent and close[0] >= iirma1[0])
if close[0] >= iirma2[0] and close[0] >= iirma3[0]
bgcolor := color.green
insqueeze := true
intightsqueeze := true
else
bgcolor := color.lime
insqueeze := true
intightsqueeze := false
else
insqueeze := false
intightsqueeze := false
// if (true)//sinceSmSignal > 0) // cutting down on fastest MAs noise
// sinceSmSignal := sinceSmSignal + 1
// if (crossoverAB)
// //checkEntry()
// //smbuySignal := true
// sinceSmSignal := 0
// if (crossunderAB) // and all NOT greennot (slope1Green and slope2Green and slope3Green)
// //checkExit()
// //smsellSignal := true
// sinceSmSignal := 0
// else
// sinceSmSignal := sinceSmSignal + 1
f_draw_infopanel(_x, _y, _line, _text, _color)=>
_rep_text = ""
for _l = 0 to _line
_rep_text := _rep_text + "\n"
_rep_text := _rep_text + _text
var label _la = na
label.delete(_la)
_la := label.new(
x=_x, y=_y,
text=_rep_text, xloc=xloc.bar_time, yloc=yloc.price,
color=color.black, style=label.style_labelup, textcolor=_color, size=size.normal)
posx = timenow + round(change(time)*60)
posy = highest(50)
// CONSTRUCTION ZONE
// TODO: program way to eliminate noise and false signals
// MAYBEDO: program it to differentiate between a moving average bump and a cross
// I think the best way would be to calculate the tangent line... OR
// Take the slope of both going back a couple bars and if it's close enough, its a bounce off
// and an excellent entry signal
// program in quickest exit, 2 bars next to eachother both closing under, as to avoid a single wick from
// prompting to close the trade
// Some other time, have it move SMA up or down depending on whether trending up or down. Then use those MA crosses
//THIS CHECKS THE SLOPE FROM CURRENT PRICE TO BACK 10 BARS
checkSlope(_series) => (_series[0]/_series[10])*100 // it now returns it as a percentage
doNewX = input(true, type=input.bool, title="══════════ Show misc MA Cross Strategy ══════════")
iirX = input(555, title="IIRx Length: ", type=input.integer)
iirXperiod = input(30, title="IIRx Period/TF: ", type=input.integer)
iirX2 = input(13, title="IIRx2 Length: ", type=input.integer)
iirX2period = input(5, title="IIRx2 Period/TF: ", type=input.integer) //15
almaXperiod = input(defval=15, title="Alma of IIR1 Period: ", type=input.integer)
almaXalpha = input(title="Alma Alpha Value: ", defval=.7, maxval=.95, type=input.float) // dont forget to try .99
almaXsigma = input(title="Alma Sigma Value: ", defval=500, type=input.float)
iirmaOTF = iirma(multiplier(iirXperiod, iirX), close)
iirma2OTF = iirma(multiplier(iirX2period, iirX2), close)
smaOTF = alma(iirmaOTF, almaXperiod, almaXalpha, almaXsigma) // maybe dont touch, its precise // I took the ALMA of the IIRMA, and i hope thats not cheating ;)
// I could have removed this. the multiplier function adjusts the length to fit the current timeframe while displaying the same
// smaXOTF = security(syminfo.tickerid, smaXperiod, smaOTF, barmerge.gaps_on, barmerge.lookahead_on)
// iirmaXOTF = security(syminfo.tickerid, iirXperiod, iirmaOTF, barmerge.gaps_on, barmerge.lookahead_on)
// iirmaX2OTF = security(syminfo.tickerid, iirX2period, iirma2OTF, barmerge.gaps_on, barmerge.lookahead_on)
plot(doNewX ? smaOTF : na, title="FastMA X-Over : ", color=color.blue, linewidth=1, transp=40)
plot(doNewX ? iirmaOTF : na, title="IIR MAx : ", color=color.purple, linewidth=1, transp=30)
plot(doNewX ? iirma2OTF : na, title="IIR MAx : ", color=color.purple, linewidth=2, transp=20)
iirma2Up = checkSlope(iirma2OTF) > 0 // just another slope up/down variable.
//calculate spaces between averages
distiiralma = abs(iirmaOTF - smaOTF)
crossoverFast = crossover(iirmaOTF, smaOTF) // and (iirmaOTF[1] <= smaOTF[1])
crossunderFast = crossunder(iirmaOTF, smaOTF) // and (iirmaOTF[1] >= smaOTF[1])
if (crossoverFast and iirma2Up == true and infastsqueeze == false and intightsqueeze == false) // and (count1 != 0))// or close[0] < (lowest(barLookbackPeriod) + singlePercent*3))) // must be at most a few percent up from a recent low. Avoid buying highs :P
buySignal := true
strategyOpen()
// if (slope1Green and slope2Green and slope3Green and infastsqueeze == false)
// checkEntry()
if (crossunderFast)
sellSignal := true
checkExit()
// I feel like I didn't cite the OG author for this panel correctly. I hope I did, but there are extentions of his/her work in multiple places.
// I could have gotten it confused.
if (debug)
f_draw_infopanel(posx, posy, 18, "distiiralma from IIR: " + tostring(distiiralma), color.lime)
//f_draw_infopanel(posx, posy, 16, "distiirs: " + tostring(distiirX1), color.lime)
f_draw_infopanel(posx, posy, 14, "Value of iirmaOTF: " + tostring(iirmaOTF), color.lime)
f_draw_infopanel(posx, posy, 6, "slope X: " + tostring(abs(100 - checkSlope(iirmaOTF))), color.lime)
f_draw_infopanel(posx, posy, 12, "value of smaOTF: " + tostring(smaOTF), color.lime)
f_draw_infopanel(posx, posy, 6, "slopeAlma: " + tostring(abs(100 - checkSlope(smaOTF))), color.lime)
f_draw_infopanel(posx, posy, 2, "slopeIIR2 " + tostring(abs(100 - checkSlope(iirma2OTF))), color.lime)
f_draw_infopanel(posx, posy, 2, "slopeIIR2 " + tostring(abs(100 - checkSlope(iirma2OTF))), color.lime)
// I kept this separate because it discludes the calculations. Its hard to hold a train of thought while fishing for the right section
bgcolor(showBackground ? bgcolor : na)
plotshape(showSignals ? buySignal : na, location=location.bottom, style=shape.circle, text="", size=size.tiny, color=color.blue, transp=60)
plotshape(showSignals ? sellSignal : na, location=location.bottom, style=shape.circle, text="", size=size.tiny, color=color.red, transp=60)
plotchar(showSignals and smbuySignal, title="smBuy", location=location.belowbar, char='↑', size=size.tiny, color=color.green, transp=0)
plotchar(showSignals and smsellSignal, title="smSell", location=location.abovebar, char='↓', size=size.tiny, color=color.orange, transp=0)
// can not display a variable. Can only match the count to a corresponding plotchar
// to display a non-constant variable, use the debug box, which was so kindly offered up by our community.
plotchar(showCounts and count1==1, title='', char='1', location=location.belowbar, color=#2c9e2c, transp=0)
plotchar(showCounts and count1==2, title='', char='2', location=location.belowbar, color=#2c9e2c, transp=0)
plotchar(showCounts and count1==3, title='', char='3', location=location.belowbar, color=#2c9e2c, transp=0)
plotchar(showCounts and count1==4, title='', char='4', location=location.belowbar, color=#2c9e2c, transp=0)
plotchar(showCounts and count1==5, title='', char='5', location=location.belowbar, color=#2c9e2c, transp=0)
plotchar(showCounts and count1==6, title='', char='6', location=location.belowbar, color=#2c9e2c, transp=0)
plotchar(showCounts and count1==7, title='', char='7', location=location.belowbar, color=#2c9e2c, transp=0)
plotchar(showCounts and count1==8, title='', char='8', location=location.belowbar, color=#2c9e2c, transp=0)
plotchar(showCounts and count1==9, title='', char='9', location=location.belowbar, color=#2c9e2c, transp=0)
plotchar(showCounts and count1>=10, title='', char='$', location=location.belowbar, color=#2c9e2c, transp=0)
plotchar(showCounts and count2==1, title='', char='1', location=location.abovebar, color=#e91e63, transp=0)
plotchar(showCounts and count2==2, title='', char='2', location=location.abovebar, color=#e91e63, transp=0)
plotchar(showCounts and count2==3, title='', char='3', location=location.abovebar, color=#e91e63, transp=0)
plotchar(showCounts and count2==4, title='', char='4', location=location.abovebar, color=#e91e63, transp=0)
plotchar(showCounts and count2==5, title='', char='5', location=location.abovebar, color=#e91e63, transp=0)
plotchar(showCounts and count2==6, title='', char='6', location=location.abovebar, color=#e91e63, transp=0)
plotchar(showCounts and count2==7, title='', char='7', location=location.abovebar, color=#e91e63, transp=0)
plotchar(showCounts and count2==8, title='', char='8', location=location.abovebar, color=#e91e63, transp=0)
plotchar(showCounts and count2==9, title='', char='9', location=location.abovebar, color=#e91e63, transp=0)
plotchar(showCounts and count2>=10, title='', char='$', location=location.abovebar, color=#e91e63, transp=0)
showRSIind = input(true, type=input.bool, title="═══════════════════ Show RSI Arrows ═══════════════════")
// Get user input
rsiSource = input(title="RSI Source", type=input.source, defval=close)
rsiLength = input(title="RSI Length", type=input.integer, defval=14)
rsiOverbought = input(title="RSI Overbought Level", type=input.integer, defval=80)
rsiOversold = input(title="RSI Oversold Level", type=input.integer, defval=20)
// Get RSI value
rsiValue = rsi(rsiSource, rsiLength)
isRsiOB = rsiValue >= rsiOverbought
isRsiOS = rsiValue <= rsiOversold
// Plot signals to chart
plotshape(isRsiOB, title="Overbought", location=location.abovebar, color=color.red, transp=0, style=shape.triangledown)
plotshape(isRsiOS, title="Oversold", location=location.belowbar, color=color.green, transp=0, style=shape.triangleup)
//reset the var variables before new calculations
buySignal := false
sellSignal := false
smbuySignal := false
smsellSignal := false
bigbuySignal := false
bigsellSignal := false