
##策略概述
该策略是一种中短期策略,结合RSI、CCI和威廉指标三个分类指标,实现买卖信号的有效组合。当三个指标同时显示超买或超卖信号时,策略会发出交易信号。相比单一使用某个指标,该组合策略可以过滤掉更多假信号,从而提高策略的稳定性。
策略名称定为“三迹rawler策略”,其中三迹喻指RSI、CCI和威廉指标的组合,Trawler则表示该策略像拖网渔船那样网住机会。
策略原理
该策略主要依赖以下几个指标进行买卖判断:
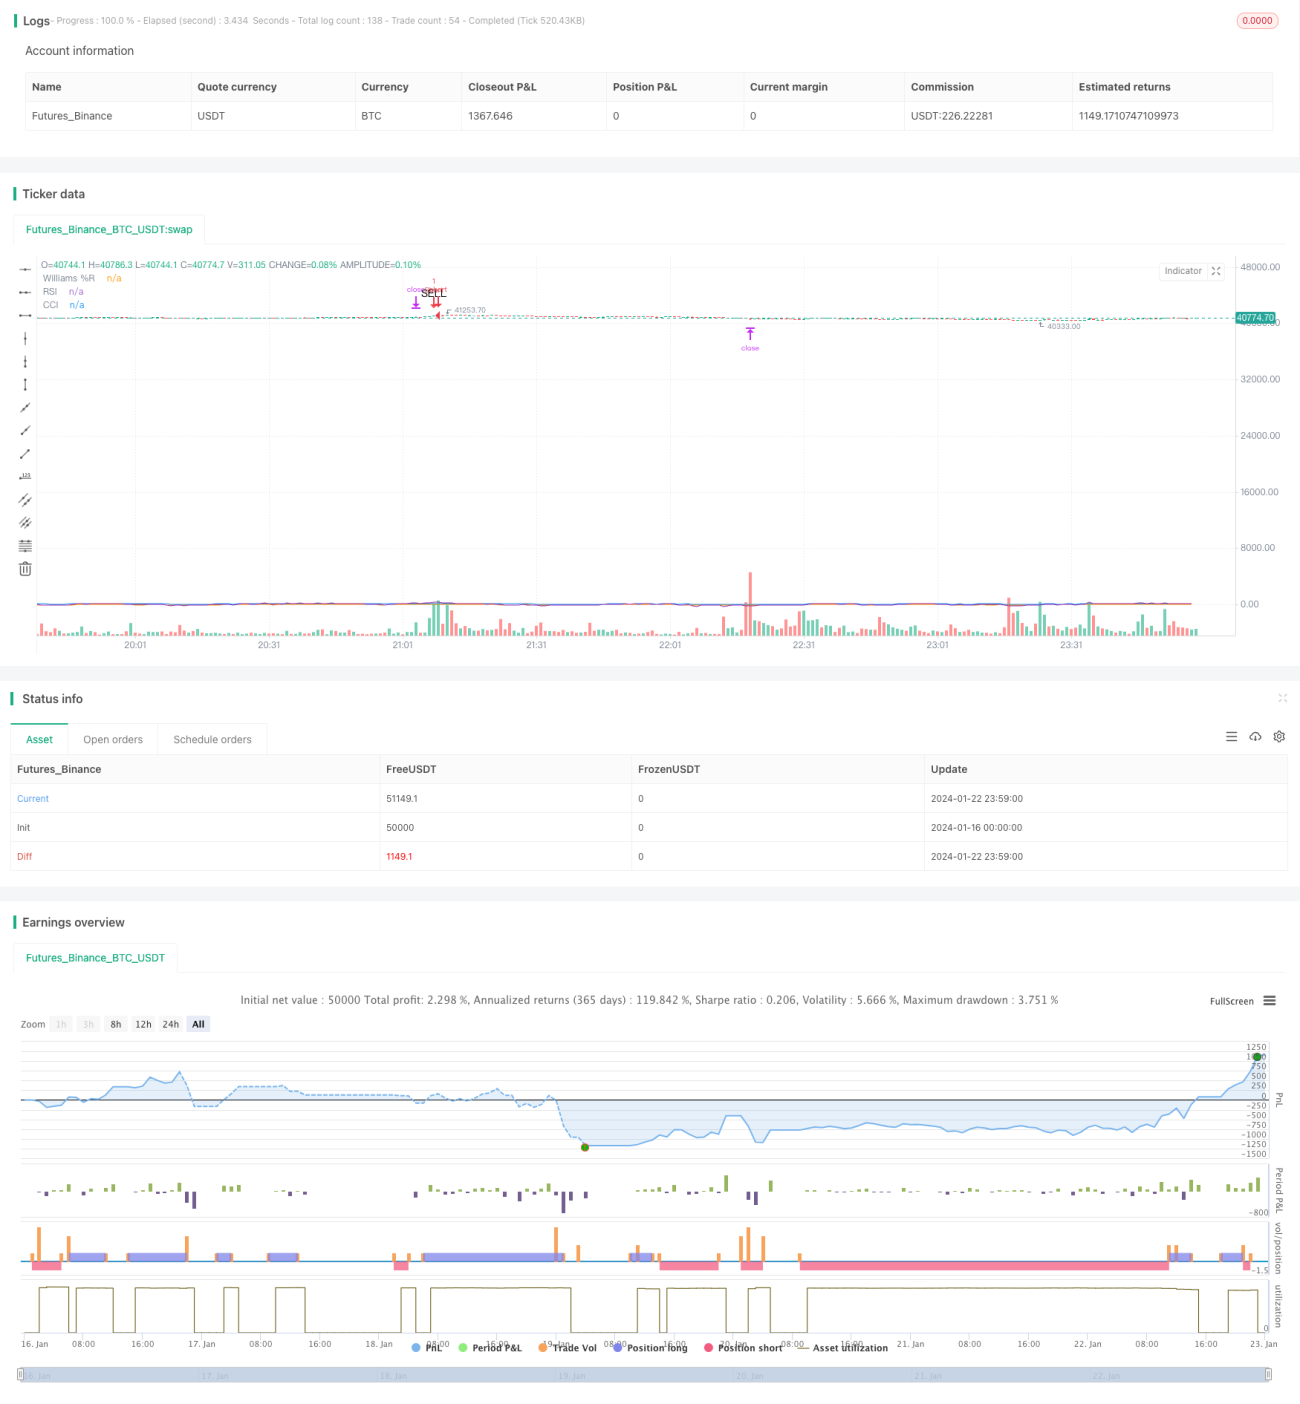
- RSI 指标判断超买超卖
- CCI 指标判断行情反转点
- Williams %R指标再次确认买卖时机
当RSI低于25时为超卖,高于75时为超买。当CCI低于-130时为超卖,高于130时为超买。当Williams %R低于-85时为超卖,高于-15时为超买。
当上述三个指标同时显示买入信号时,即RSI < 25,CCI < -130,Williams %R < -85,则策略做多;当显示卖出信号时,即RSI > 75,CCI > 130,Williams %R > -15,则策略做空。
这样可以避免单一指标产生的假信号,提高信号的可靠性。同时配置止损和止盈,以控制单笔交易的风险和收益。
策略优势
-
多指标组合过滤假信号
该策略通过RSI、CCI、Williams %R三个指标的组合,可以有效过滤掉一些单一指标Below的假买卖信号,从而提升信号的可靠性。 -
自动止盈止损管理风险
策略内置了止盈和止损设置,可以自动对每笔交易设置止盈和止损价格,有效控制单笔交易的损失,避免超出可承受范围。 -
适用于中短期交易
该策略更适合中短期交易,通过指标组合判断较为明确的中短期趋势反转。对于短期噪音和中长期趋势识别能力较弱。 -
回测数据充足
策略采用的是欧元兑美元的45分钟K线,这是外汇市场上流动性强、数据充足的品种,可以减少数据不足带来的过拟合风险。
策略风险
-
中长期趋势判断能力较弱
该策略更依赖指标的反转信号,对中长期趋势的判断和跟随能力较弱,如果遇到长期单边行情时,则交易获利空间会受到限制。 -
可能错过短期价格波动
策略以45分钟为周期,无法抓住更高频 like的短期价格波动获利机会。如果短期存在更大的价格波动,策略可能会漏掉这些机会。 -
系统性风险影响
该策略主要运用于欧元兑美元品种。如果遇到重大的经济危机,全球外汇市场出现 Below波动,则策略的交易规则可能会失效,带来较大亏损。
策略优化方向
-
结合趋势跟随指标
可以尝试在策略中加入平均线指标 like MA、Boll等,助力判断中长期趋势,在趋势方向更明确时开仓,可以提高获利概率。 -
优化止损止盈策略
可以通过更多历史数据的回测,评估不同的止损止盈参数对最终盈利的影响,寻找最优参数组合。此外也可以考虑动态止损止盈。 -
扩大适用品种
当前策略主要运用于欧元兑美元品种。我们可以尝试在其他主流品种比如英镑、日元、澳元等品种中应用该策略,检验其稳定性和扩展性。
总结
“三迹Trawler策略”通过 RSI、CCI 和Williams %R三个指标的组合判断价格反转点,在超买超卖时发出交易信号。相比单一指标,该组合策略过滤了更多假信号,可以有效提高信号准确率。通过自动化的止盈止损管理,控制了交易风险。总体而言,该策略较为稳定,适合中短期操作,可以为我们的量化交易系统增加一个模块。但我们也要注意该策略在判断中长期趋势和抓住短期价格波动方面的不足。我们可以通过引入趋势跟随指标、优化止盈止损参数、扩大适用品种等手段不断完善该策略,使其成为量化系统中的一个稳定收益来源。
- 1