概述
该策略是一种基于Coinbase交易所3分钟K线的高频交易策略。它通过计算K线的上下影线,来判断价格在短期内是否出现反转机会。当价格上涨或下跌幅度较大时,策略会采取与趋势相反的头寸,以期望短线反转。
策略原理
该策略主要判断价格是否出现短期“超买”或“超卖”的机会。“超买超卖”通常来自于市场过度乐观或悲观的情绪。当出现这种临时的情绪失衡时,价格通常会产生反转。
具体来说,策略计算K线的上下影线大小,影线越大表示当前K线未结时买盘力量和卖盘力量的对抗越激烈。如果上影线过大,说明许多买单在K线收盘前被抛盘打败,预示着多头力量即将衰竭;如果下影线过大,说明许多卖单在K线收盘前被买盘吸收,预示着空头力量即将衰竭。
根据这个判断逻辑,策略在影线过大时(即价格出现短期“超买超卖”时),选择取与趋势相反的仓位。进入多头仓位的止损价格为下影线中间价格,进入空头仓位的止损价格为上影线中间价格。
优势分析
该策略最大的优势在于撬动市场短期的非理性波动,实现反向套利。它只需要较少的资金就可以获得较高的效率。
另一个优势在于,Coinbase是一个波动较大的交易所。该策略正好利用了其价格的剧烈波动来获利。
风险分析
该策略面临的最大风险,在于短期价格波动可能没有太多可预测性。上下影线的大小不一定能Capture价格反转的全部信息。交易者的非理性情绪也不一定遵循逻辑规律。所以该策略依然面临一定的随机性风险。
此外,止损点的设置也比较关键。止损点过于宽松,可能增加策略的亏损;止损点过于严格,则可能错过机会。这里需要在盈亏比和胜率间找到平衡。
优化方向
该策略可以从以下几个维度进一步优化:
- 测试不同交易品种,比如更加波动的加密资产
- 优化止损点的设置逻辑,比如结合ATR止损
- 增加机器学习模型判断价格反转概率
- 结合情绪指标衡量市场乐观/悲观指数
- 优化仓位和资金管理策略
总结
该策略整体来说是一种典型的统计套利策略。它试图利用价格短期的非理性波动获利,具有一定的逻辑性和可实施性。下一步可以从更多维度进行优化实验,使策略的参数设置和交易规则更加科学系统。
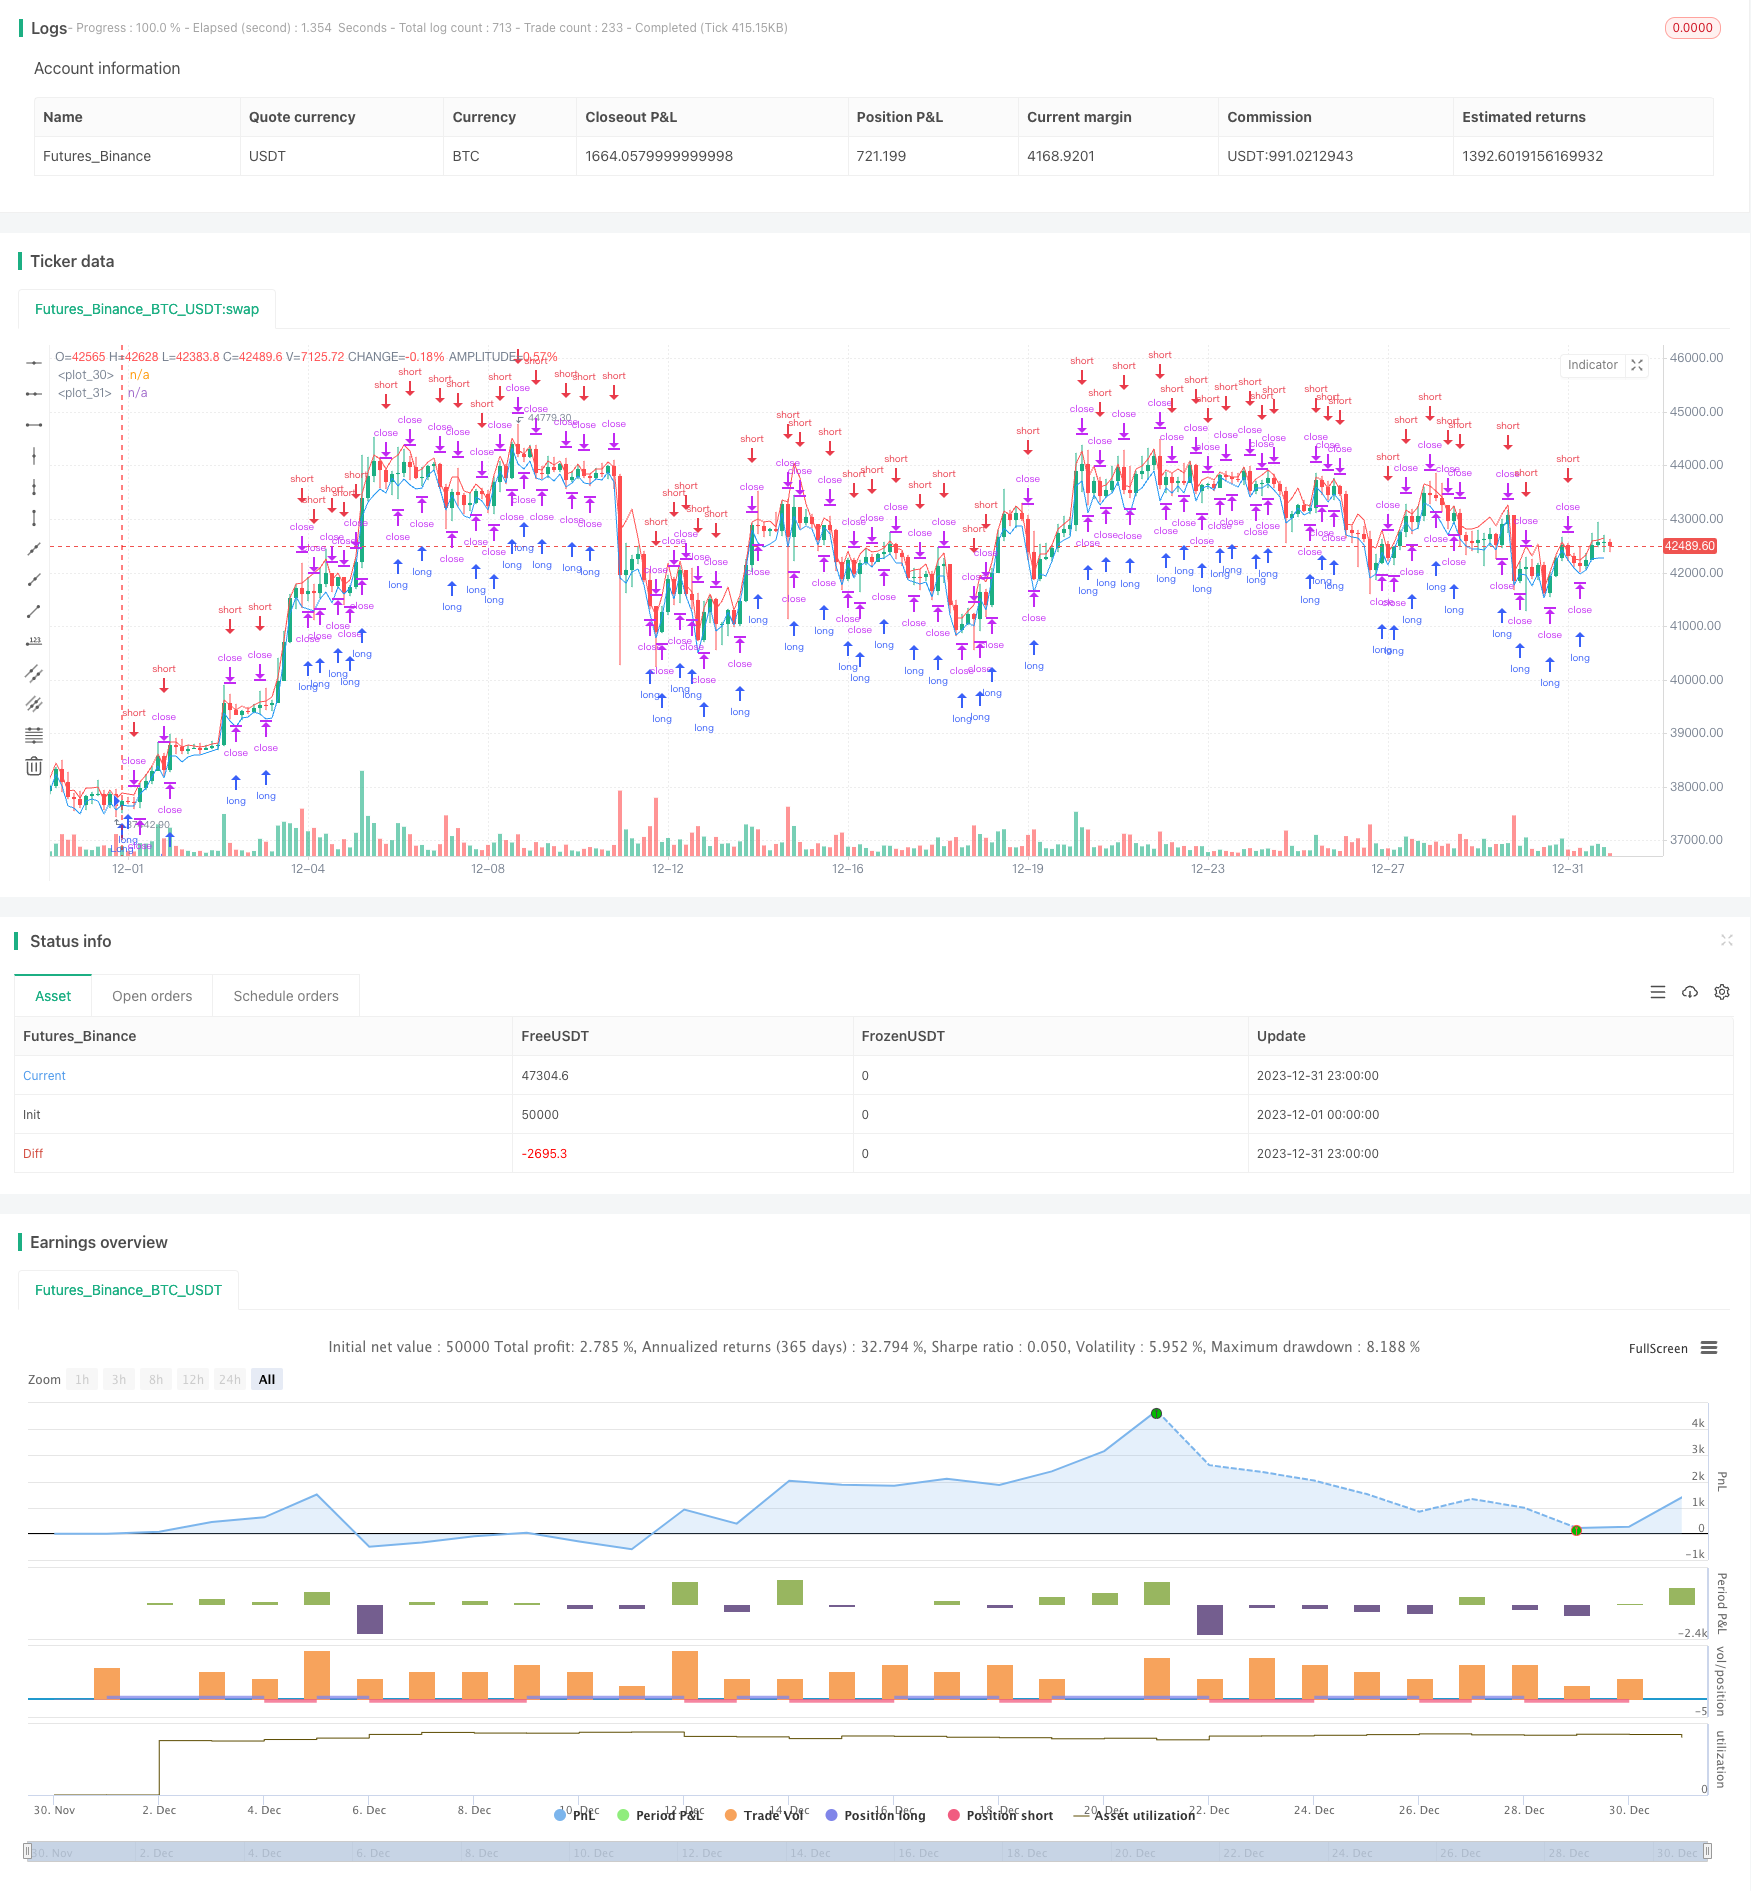
/*backtest
start: 2023-12-01 00:00:00
end: 2023-12-31 23:59:59
period: 3h
basePeriod: 15m
exchanges: [{"eid":"Futures_Binance","currency":"BTC_USDT"}]
*/

//@version=3
//for coinbase, 3min logic
//This strategy trades against the short term trend. The first position can be either long or short.
//In the short term, prices fluctuate up and down on wide spread exchanges.
//And if the price moves to one side, the price tends to return to its original position momentarily.
//This strategy set stop order. Stop price is calculated with upper and lower shadows.

strategy("ndb_mm_for_coinbase_btcusd", overlay=true, initial_capital=100000, slippage=50)

fromyear = input(2019, minval = 2017, maxval = 2100, title = "From Year")
frommonth = input(12, minval = 1, maxval = 12, title = "From Month")
fromday = input(1, minval = 01, maxval = 31, title = "From day")
toyear = input(2100, minval = 1900, maxval = 2100, title = "To Year")
tomonth = input(12, minval = 01, maxval = 12, title = "To Month")
today = input(31, minval = 01, maxval = 31, title = "To day")
end = true

length = input(3, title="period")
mag = input(1.2, title="sigma", minval=0.1, step=0.1)

up_shadow = abs(high - max(open, close))
dn_shadow = abs(low - min(open, close))

up_shadow_ma = sma(up_shadow, length) * mag
dn_shadow_ma = sma(dn_shadow, length) * mag

upper = close + dn_shadow_ma
lower = close - up_shadow_ma

plot(upper, color=red)
plot(lower, color=blue)

if strategy.position_size == 0
    strategy.entry("Long", strategy.long)

if 0 < strategy.position_size
    strategy.entry("Short", strategy.short, stop=lower, when=end)

if 0 > strategy.position_size
    strategy.entry("Long", strategy.long, stop=upper, when=end)