概述
双向交叉零轴Qstick指标回测策略是基于Tushar Chande开发的Qstick技术指标的趋势跟踪和交易信号生成策略。该策略通过计算股票的开盘价和收盘价的移动平均差值,判断市场的买入压力和卖出压力,并在该差值指标交叉零轴时生成交易信号。
策略原理
双向交叉零轴Qstick策略的核心指标是Qstick。Qstick指标是通过计算一定周期内收盘价与开盘价的差值的移动平均来获得的。当Qstick大于0时,表示该周期内收盘价整体高于开盘价,多头力量占优;当Qstick小于0时,表示该周期内开盘价整体高于收盘价,空头力量占优。
该策略的交易信号来自Qstick指标何时穿过零轴。当Qstick从下方向上穿过零轴时产生买入信号,这表示买入压力开始高于卖出压力,可以建立多头头寸;相反,当Qstick从上方向下穿过零轴时产生卖出信号,表示卖出压力开始加大,需要清仓卖出头寸。此外,该策略也可绘制Qstick值的移动平均线作为信号线,Qstick指标何时穿过该信号线也会产生交易信号。
该策略允许选择反转交易。即当原本应该产生买入信号时,实际采取卖出操作;当原本应该产生卖出信号时,实际采取买入操作。这可以用于反转跟随市场意识形态的主流投资者。
优势分析
双向交叉零轴Qstick策略具有以下优势:
- 使用简单直观的指标判断市场买卖压力,信号生成清晰
- 采用移动平均差值指标,可有效滤除市场噪音
- 可绘制信号线,避免错误信号
- 支持反转交易,可用于跟踪主流投资者
- 可自定义参数,适应不同股票和市场环境
风险分析
双向交叉零轴Qstick策略也存在一些风险:
- Qstick指标延迟识别趋势转折点,可能错过最佳入场点
- 信号频繁,交易成本较高
- 反转交易风险大,需要谨慎运用
可以通过以下方法降低风险:
- 优化Qstick周期参数,降低指标延迟
- 增大信号线周期参数,减少错误信号
- 只在特定阶段采取反转交易,并控制仓位规模
优化方向
双向交叉零轴Qstick策略可以从以下几个方面进行优化:
- 结合其他指标过滤信号,例如成交量指标、波动率指标等,避免在非趋势环境下产生错误信号
- 增加止损策略,在亏损达到一定比例时止损
- 进一步研究确定最佳的Qstick和信号线周期参数组合
- 通过机器学习方法自动确定最优参数
- 在特定行业或个股中测试该策略的效果
总结
双向交叉零轴Qstick策略利用简单的指标判断买卖压力变化,在Qstick指标交叉零轴时产生交易信号,可有效捕捉价格趋势。该策略直观易懂,适合初学者使用,也可通过多种手段进行优化,适应高级交易员的需要。但是该策略也存在一定缺陷,需要谨慎运用。总体来说,这是一个非常实用的趋势跟踪和信号生成策略。
策略源码
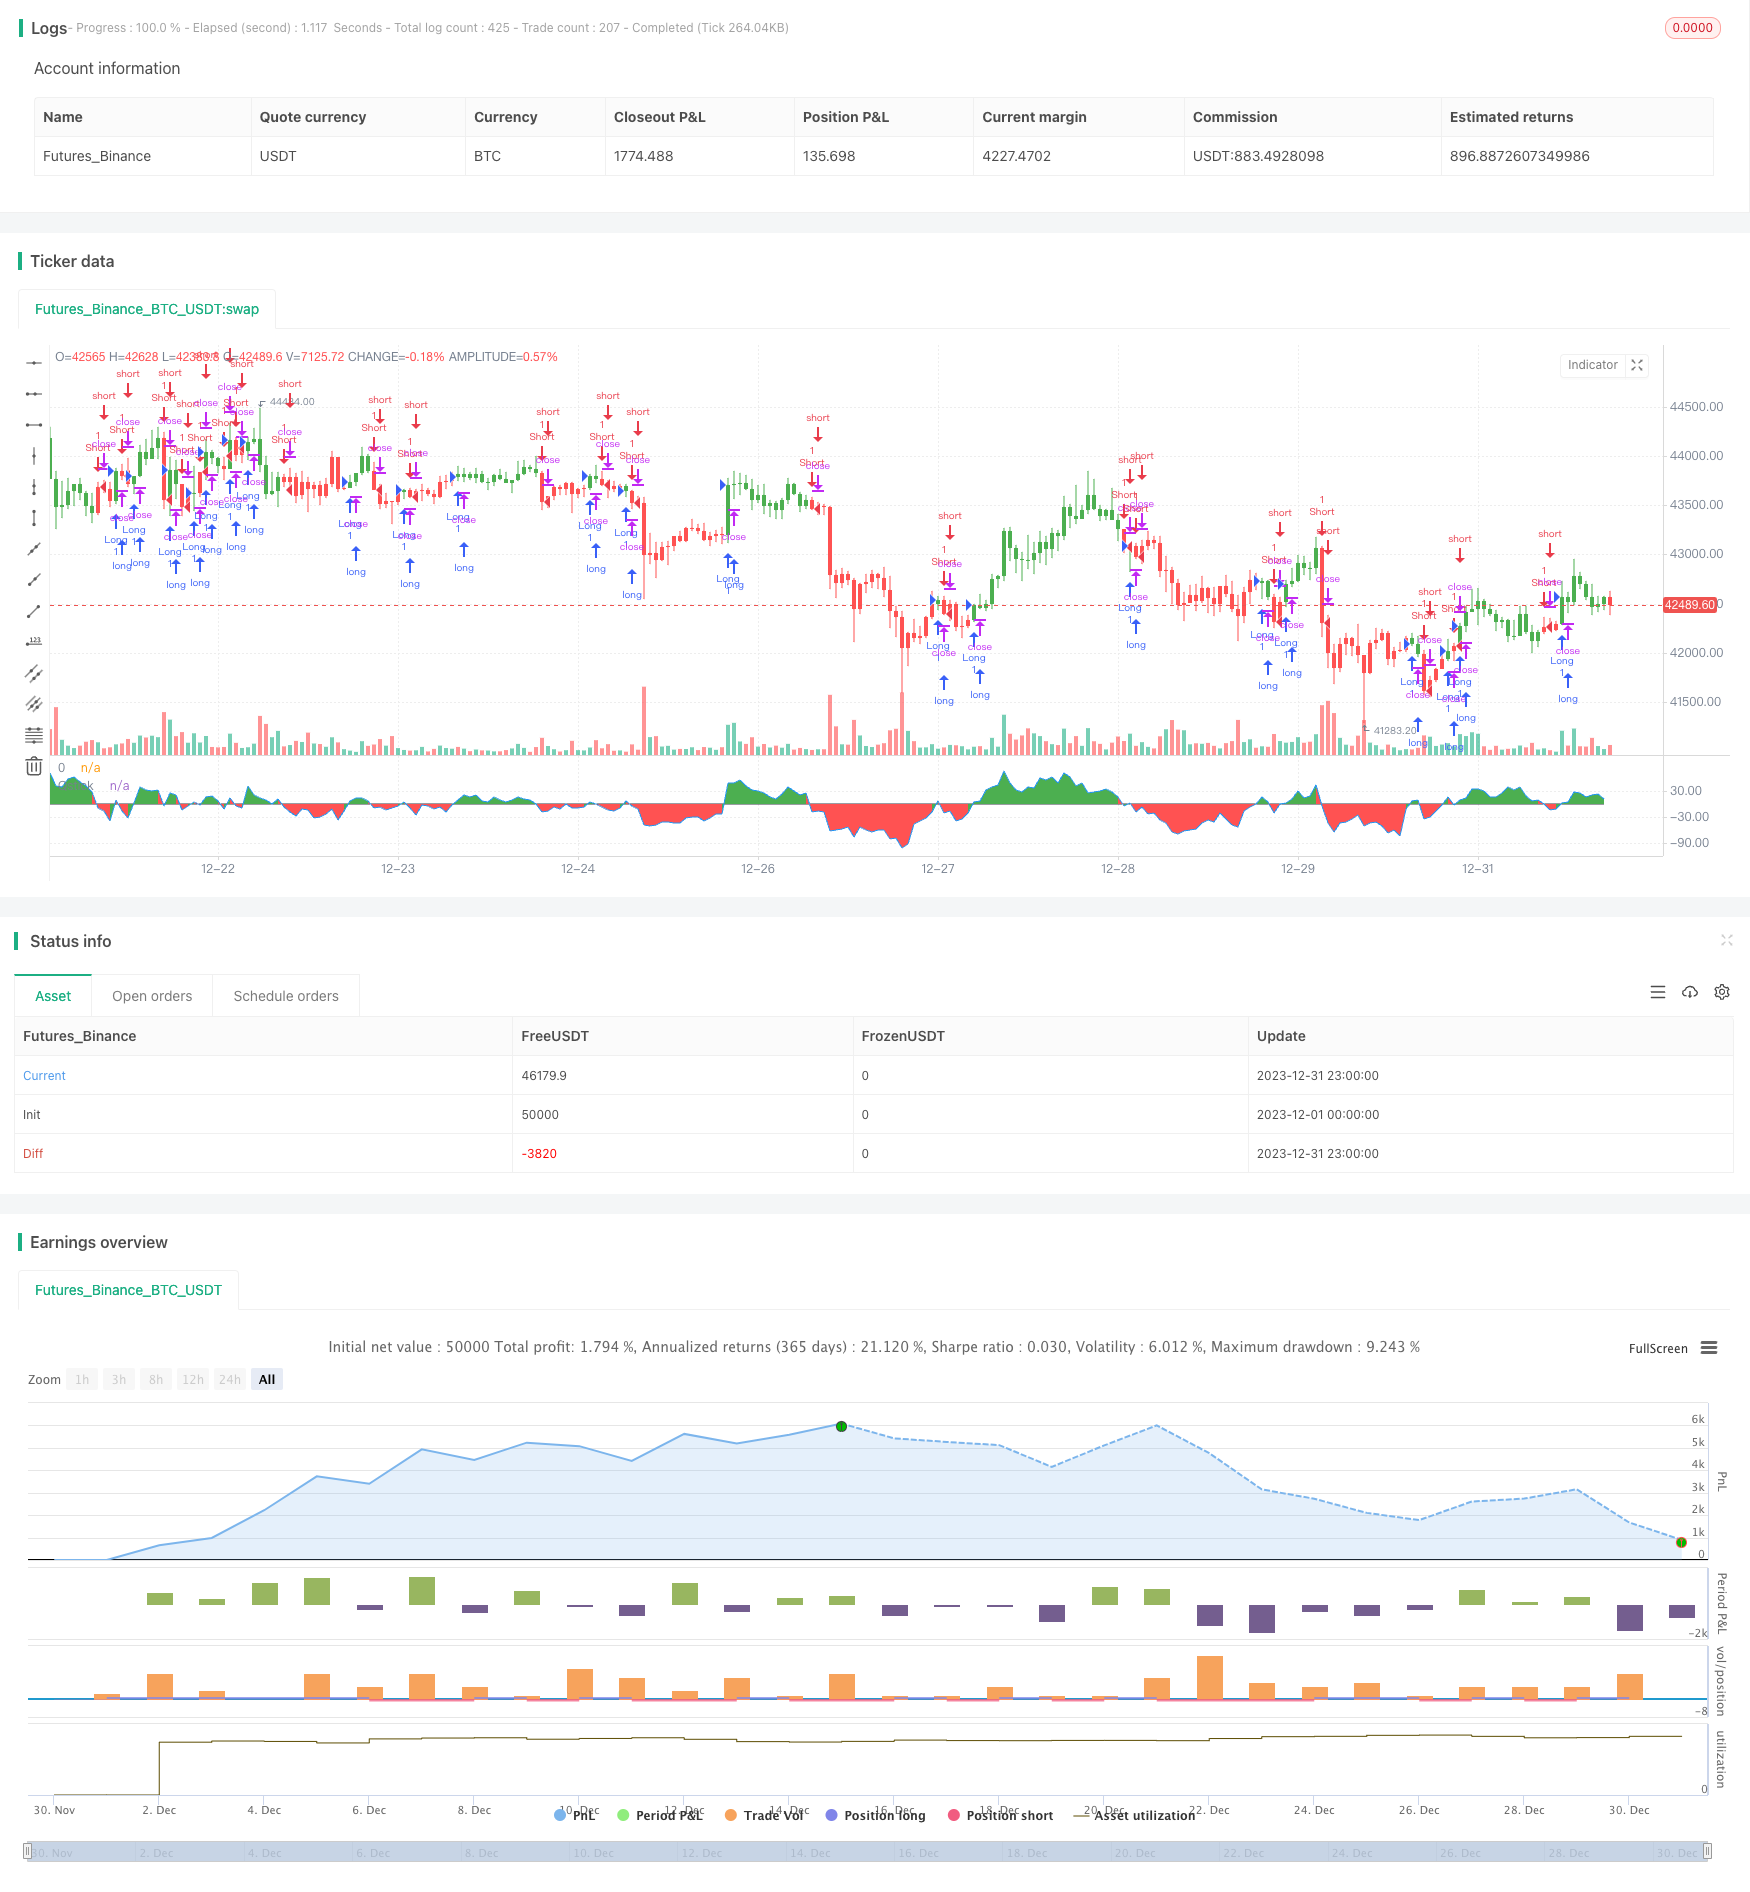
/*backtest
start: 2023-12-01 00:00:00
end: 2023-12-31 23:59:59
period: 1h
basePeriod: 15m
exchanges: [{"eid":"Futures_Binance","currency":"BTC_USDT"}]
*/

//@version=2
////////////////////////////////////////////////////////////
//  Copyright by HPotter v1.0 16/04/2018
// A technical indicator developed by Tushar Chande to numerically identify
// trends in candlestick charting. It is calculated by taking an 'n' period
// moving average of the difference between the open and closing prices. A
// Qstick value greater than zero means that the majority of the last 'n' days
// have been up, indicating that buying pressure has been increasing.
//
// Transaction signals come from when the Qstick indicator crosses through the
// zero line. Crossing above zero is used as the entry signal because it is indicating
// that buying pressure is increasing, while sell signals come from the indicator
// crossing down through zero. In addition, an 'n' period moving average of the Qstick
// values can be drawn to act as a signal line. Transaction signals are then generated
// when the Qstick value crosses through the trigger line.
//
// You can change long to short in the Input Settings
// WARNING:
//  - For purpose educate only
//  - This script to change bars colors.
////////////////////////////////////////////////////////////
strategy(title="Qstick Indicator Backtest")
Length = input(14, minval=1)
reverse = input(false, title="Trade reverse")
xR = close - open
xQstick = sma(xR, Length)
clr = iff(xQstick >= 0, green, red)
pos = iff(xQstick > 0, 1,
       iff(xQstick < 0, -1, nz(pos[1], 0)))
possig = iff(reverse and pos == 1, -1,
          iff(reverse and pos == -1, 1, pos))
if (possig == 1)
    strategy.entry("Long", strategy.long)
if (possig == -1)
    strategy.entry("Short", strategy.short)
barcolor(possig == -1 ? red: possig == 1 ? green : blue )
p1 = plot(0, color=black, title="0")
p2 = plot(xQstick, color=blue, title="Qstick")
fill(p1, p2, color=clr)