概述
本策略名称为“基于SMA均线交叉配合市场深度指标一抛一的量化交易策略”。该策略主要利用SMA均线的金叉死叉讯号,结合Ichimoku市场深度云图指标中的转换线、基准线和前沿线以及交易量的多空指标,实现对比特币正反向的自动交易。
策略原理
该策略主要基于以下原理:
使用不同参数的SMA均线构建金叉死叉交易讯号。当短期SMA上穿长期SMA时生成买入讯号,当短期SMA下穿长期SMA时生成卖出讯号。
基于Ichimoku云图指标判断市场深度和趋势。只有当收盘价高于云图的前沿线和基准线时才产生买入讯号,低于云图的前沿线和基准线时才产生卖出讯号,从而过滤了大部分假讯号。
基于交易量的多空指标过滤掉低量的假讯号,只有当交易量大于一定期间平均量时才会产生买入卖出讯号。
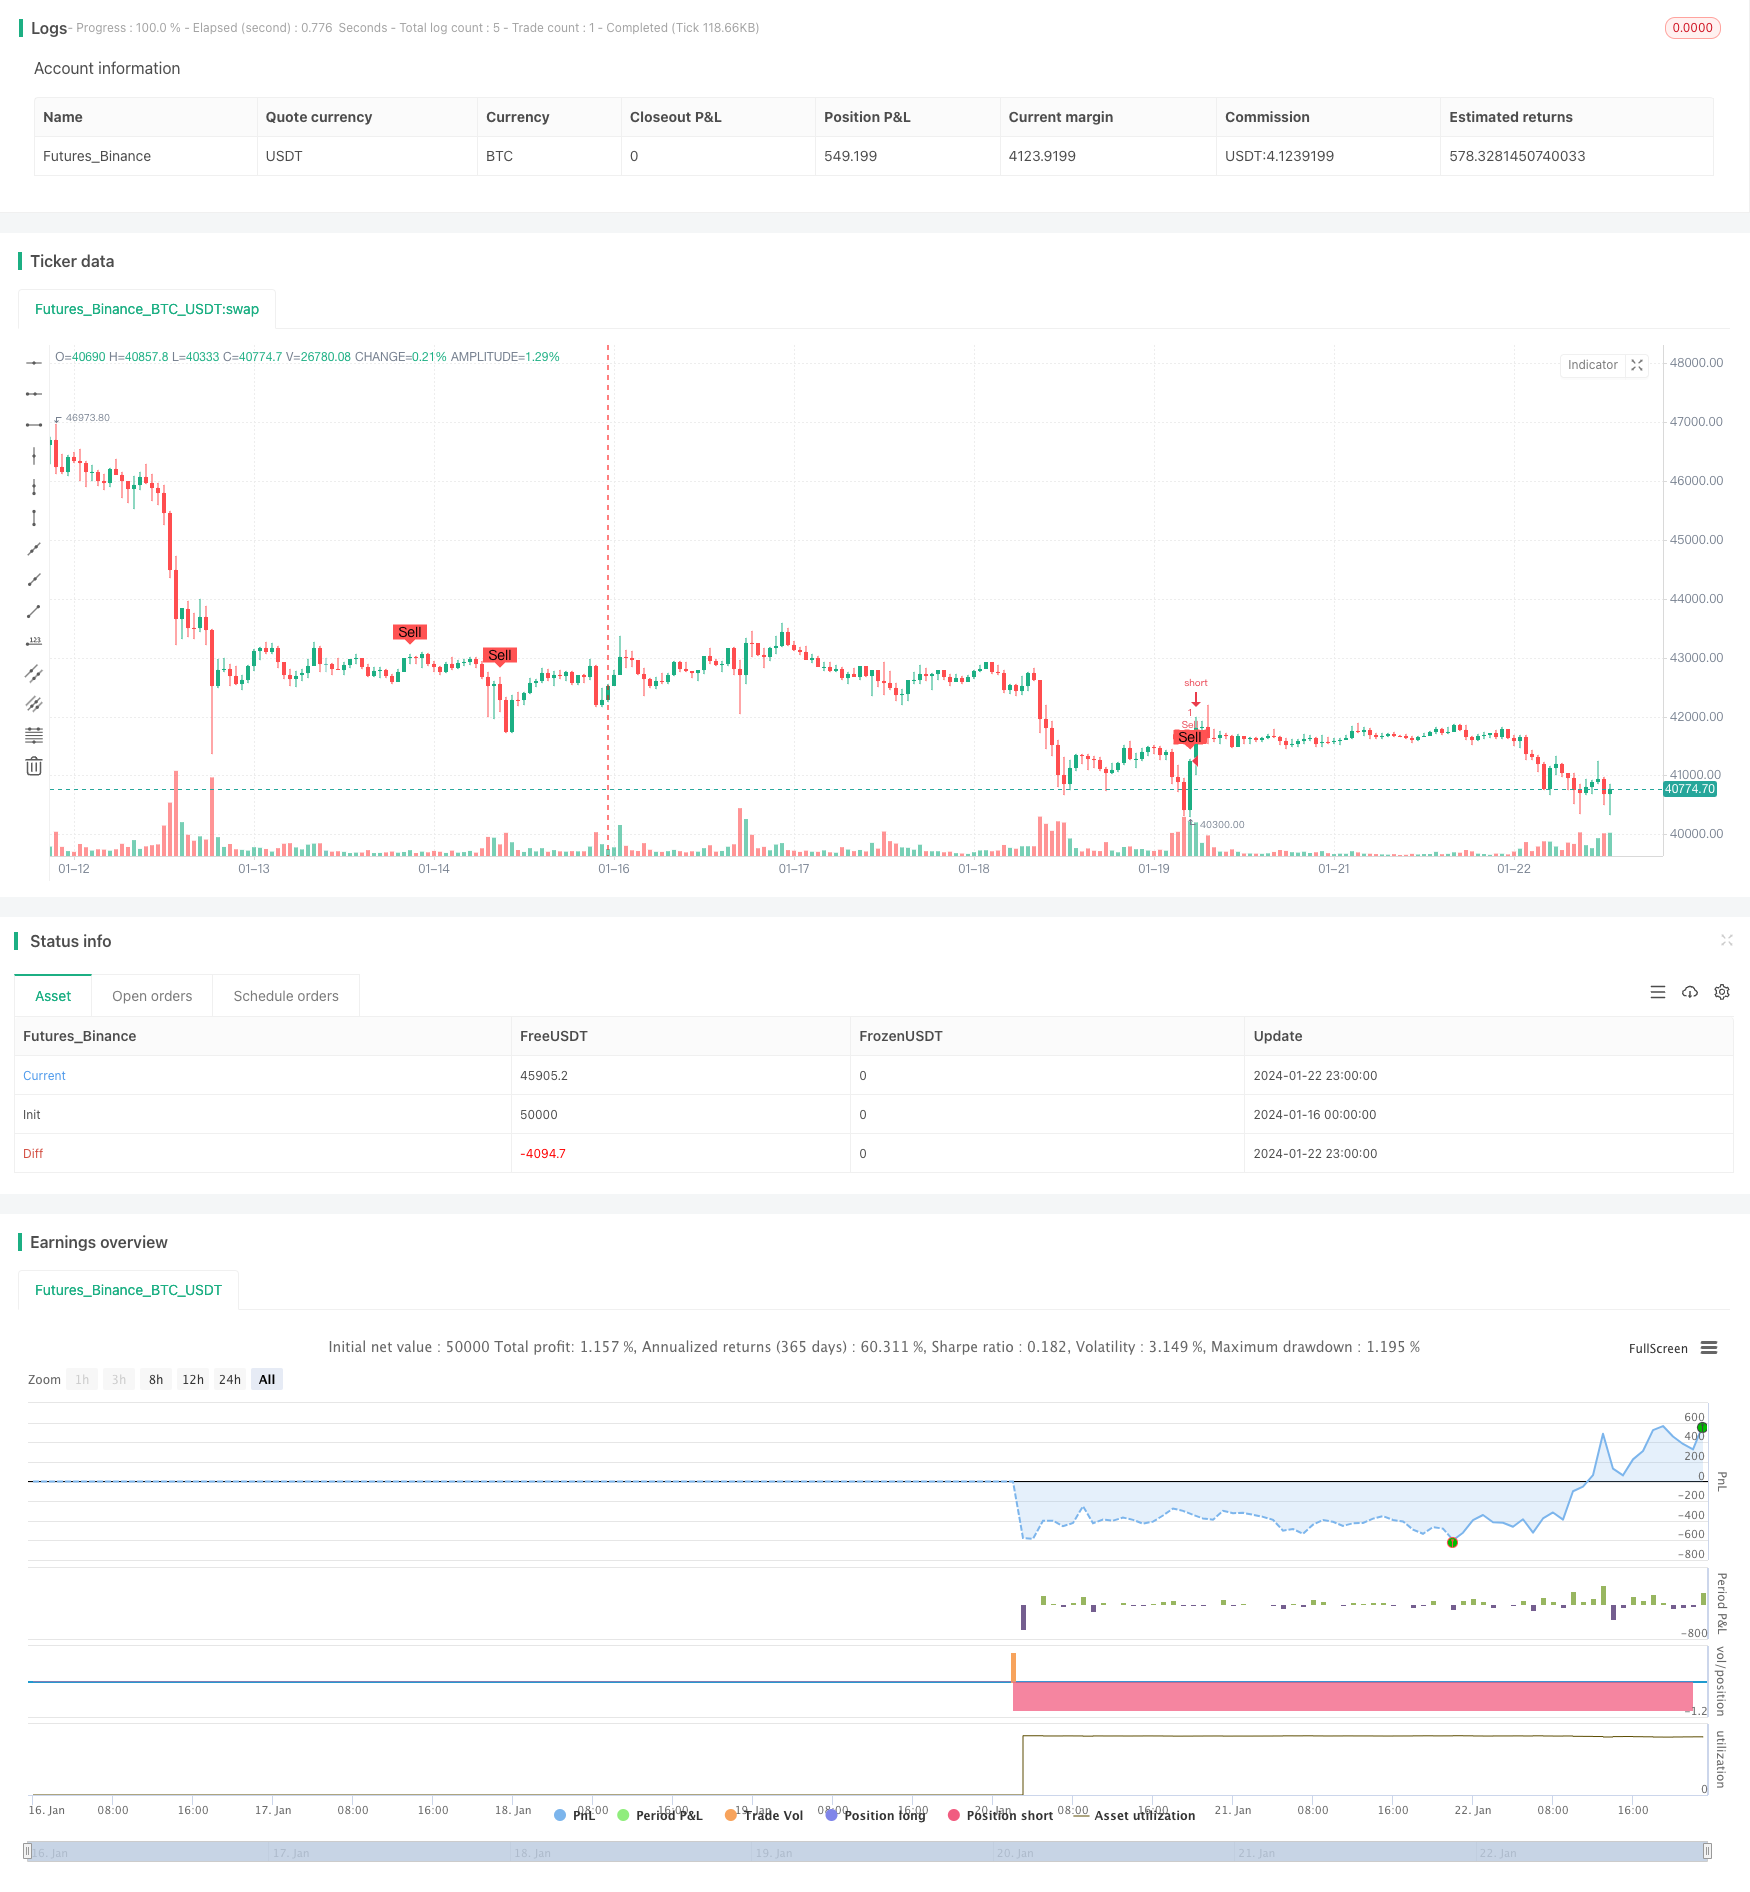
通过plotshape函数在图表上标记买入卖出讯号的位置。
这样,该策略综合考虑了短期和长期趋势、市场深度指标和交易量指标,优化了交易决策。
优势分析
该策略具有以下优势:
- 利用SMA均线的金叉死叉产生基本的买卖讯号,避免复杂度太高。
- 借助Ichimoku云图判断市场深度和中长期趋势,可有效过滤噪音。
- 结合交易量指标可避免低量的假突破。
- 参数调节空间大,可针对不同市场进行优化。
- 策略逻辑清晰,容易理解和修改。
- 直观显示买入卖出讯号,便于策略测试优化。
风险分析
该策略也存在以下风险:
- SMA均线容易产生误导信号,需要过滤器进行辅助。
- Ichimoku云图指标判断市场结构的效果取决于参数设置。
- 交易量放大效应可能干扰交易量指标的判断。
- 趋势市场和震荡市场需要不同的参数设置。
- 存在一定的时间滞后问题。
针对这些风险,可通过调整均线参数、云图参数、交易量参数等进行优化,同时挑选合适的交易品种,降低风险。
优化方向
该策略可从以下几个方向进行优化:
- 测试更多均线指标,如EMA、VIDYA等。
- 尝试不同的云图参数设置。
- 基于动量指标进行辅助判断。
- 加入止损机制。
- 针对不同的交易市场和品种进行参数优化。
- 尝试机器学习等方法动态优化参数。
总结
本策略综合运用了均线交叉、市场深度指标和交易量指标,形成了一个较为稳定和可靠的量化交易策略。该策略可通过参数调优、加入新的技术指标等方式进一步优化,其回测和实盘结果值得期待。总的来说,该策略为初学者提供了一个较好的学习案例。
策略源码
/*backtest
start: 2024-01-16 00:00:00
end: 2024-01-23 00:00:00
period: 1h
basePeriod: 15m
exchanges: [{"eid":"Futures_Binance","currency":"BTC_USDT"}]
*/

//@version=4
strategy("SMA Crossover with Ichimoku & Volume", shorttitle="SCIV", overlay=true)

// Define the length of SMA
shortSmaLength = input(14, title="Short SMA Length")
longSmaLength = input(21, title="Long SMA Length")
volumeLength = input(20, title="Volume Moving Average Length")

// Calculate the SMA and Volume MA
shortSma = sma(close, shortSmaLength)
longSma = sma(close, longSmaLength)
volumeMa = sma(volume, volumeLength)

// Define the lengths of the Ichimoku Cloud components
tenkanLength = input(9, title="Tenkan Length")
kijunLength = input(26, title="Kijun Length")
senkouBLength = input(52, title="Senkou B Length")
displacement = input(26, title="Displacement")

// Calculate the Ichimoku Cloud components
tenkan = (highest(high, tenkanLength) + lowest(low, tenkanLength)) / 2
kijun = (highest(high, kijunLength) + lowest(low, kijunLength)) / 2
senkouA = (tenkan + kijun) / 2
senkouB = (highest(high, senkouBLength) + lowest(low, senkouBLength)) / 2

// Define the conditions for entry and exit with Ichimoku filter and Volume filter
buyEntry = crossover(shortSma, longSma) and close > senkouA[displacement] and close > senkouB[displacement] and volume > volumeMa
sellEntry = crossunder(shortSma, longSma) and close < senkouA[displacement] and close < senkouB[displacement] and volume > volumeMa

// Plot buy/sell conditions on the chart for visual inspection
plotshape(buyEntry, style=shape.labelup, location=location.belowbar, color=color.green, text="Buy", size=size.small)
plotshape(sellEntry, style=shape.labeldown, location=location.abovebar, color=color.red, text="Sell", size=size.small)

// Execute the strategy
if (buyEntry)
    strategy.entry("Buy", strategy.long)
if (sellEntry)
    strategy.entry("Sell", strategy.short)