概述
双移动均线突破策略(Dual Moving Average Breakout Strategy)是一个基于快速移动均线和慢速移动均线的量化交易策略。它使用两个不同周期的指数移动均线(EMA)作为交易信号。当快速移动均线上穿慢速移动均线时,产生买入信号;当快速移动均线下穿慢速移动均线时,产生卖出信号。
策略原理
该策略的核心逻辑是使用快速移动均线和慢速移动均线形成交易信号。策略中定义了快速移动均线周期为12日,慢速移动均线周期为26日。计算方法如下:
- 计算价格数组的指数移动均线AP,周期为2日
- 在AP的基础上计算出快速移动均线Fast,周期为12日
- 在AP的基础上计算出慢速移动均线Slow,周期为26日
- 比较快速移动均线和慢速移动均线:
- 当Fast上穿Slow时为多头信号
- 当Fast下穿Slow时为空头信号
- 结合价格与移动均线的关系判断具体交易信号:
- 多头信号:Fast>Slow && AP>Fast
- 空头信号:Fast
通过快速移动均线和慢速移动均线的交叉来判断市场趋势和产生交易信号,是一种典型的双移动均线策略。
优势分析
双移动均线突破策略具有以下优势:
- 策略逻辑简单清晰,易于理解和实现
- 通过调整移动均线周期,可以适应不同市场环境
- 可以同时做多做空,实现更高的收益
- 可以结合价格与移动均线关系发出更精确的交易信号
- 移动均线具有一定的滞后性,可以有效滤除市场噪音
风险分析
双移动均线突破策略也存在一定的风险:
- 当市场处于震荡期,会出现更多的错误信号
- 双移动均线策略容易形成曲线拟合,忽略了市场结构性变化
- 仅依赖技术指标易受到假突破的影响,存在亏损风险
解决方法:
- 优化移动均线的周期,使其更加符合当前市场状态
- 结合其他指标如成交量确认信号,避免假突破
- 采用趋势追踪策略,控制盈亏比例,降低风险
优化方向
双移动均线突破策略可以从以下方面进行优化:
- 找到更加合适的移动均线周期组合,适应市场的变化
- 增加成交量等指标进行信号过滤,确保交易信号的有效性
- 结合市场结构指标,识别趋势和调整均线周期参数
- 采用动态移动均线可以根据市场变化自动调整周期
- 结合止损策略,可以有效控制风险,保护资金
总结
双移动均线突破策略是一个简单实用的量化交易策略。它具有策略逻辑简单,容易实现等优势,也存在一定的市场适应性问题。我们可以通过参数优化、信号过滤、风险控制等方法使其成为一个稳定获利的交易系统。总的来说,双移动均线策略是一个非常好的策略原型,值得量化交易者深入研究和应用。
策略源码
/*backtest
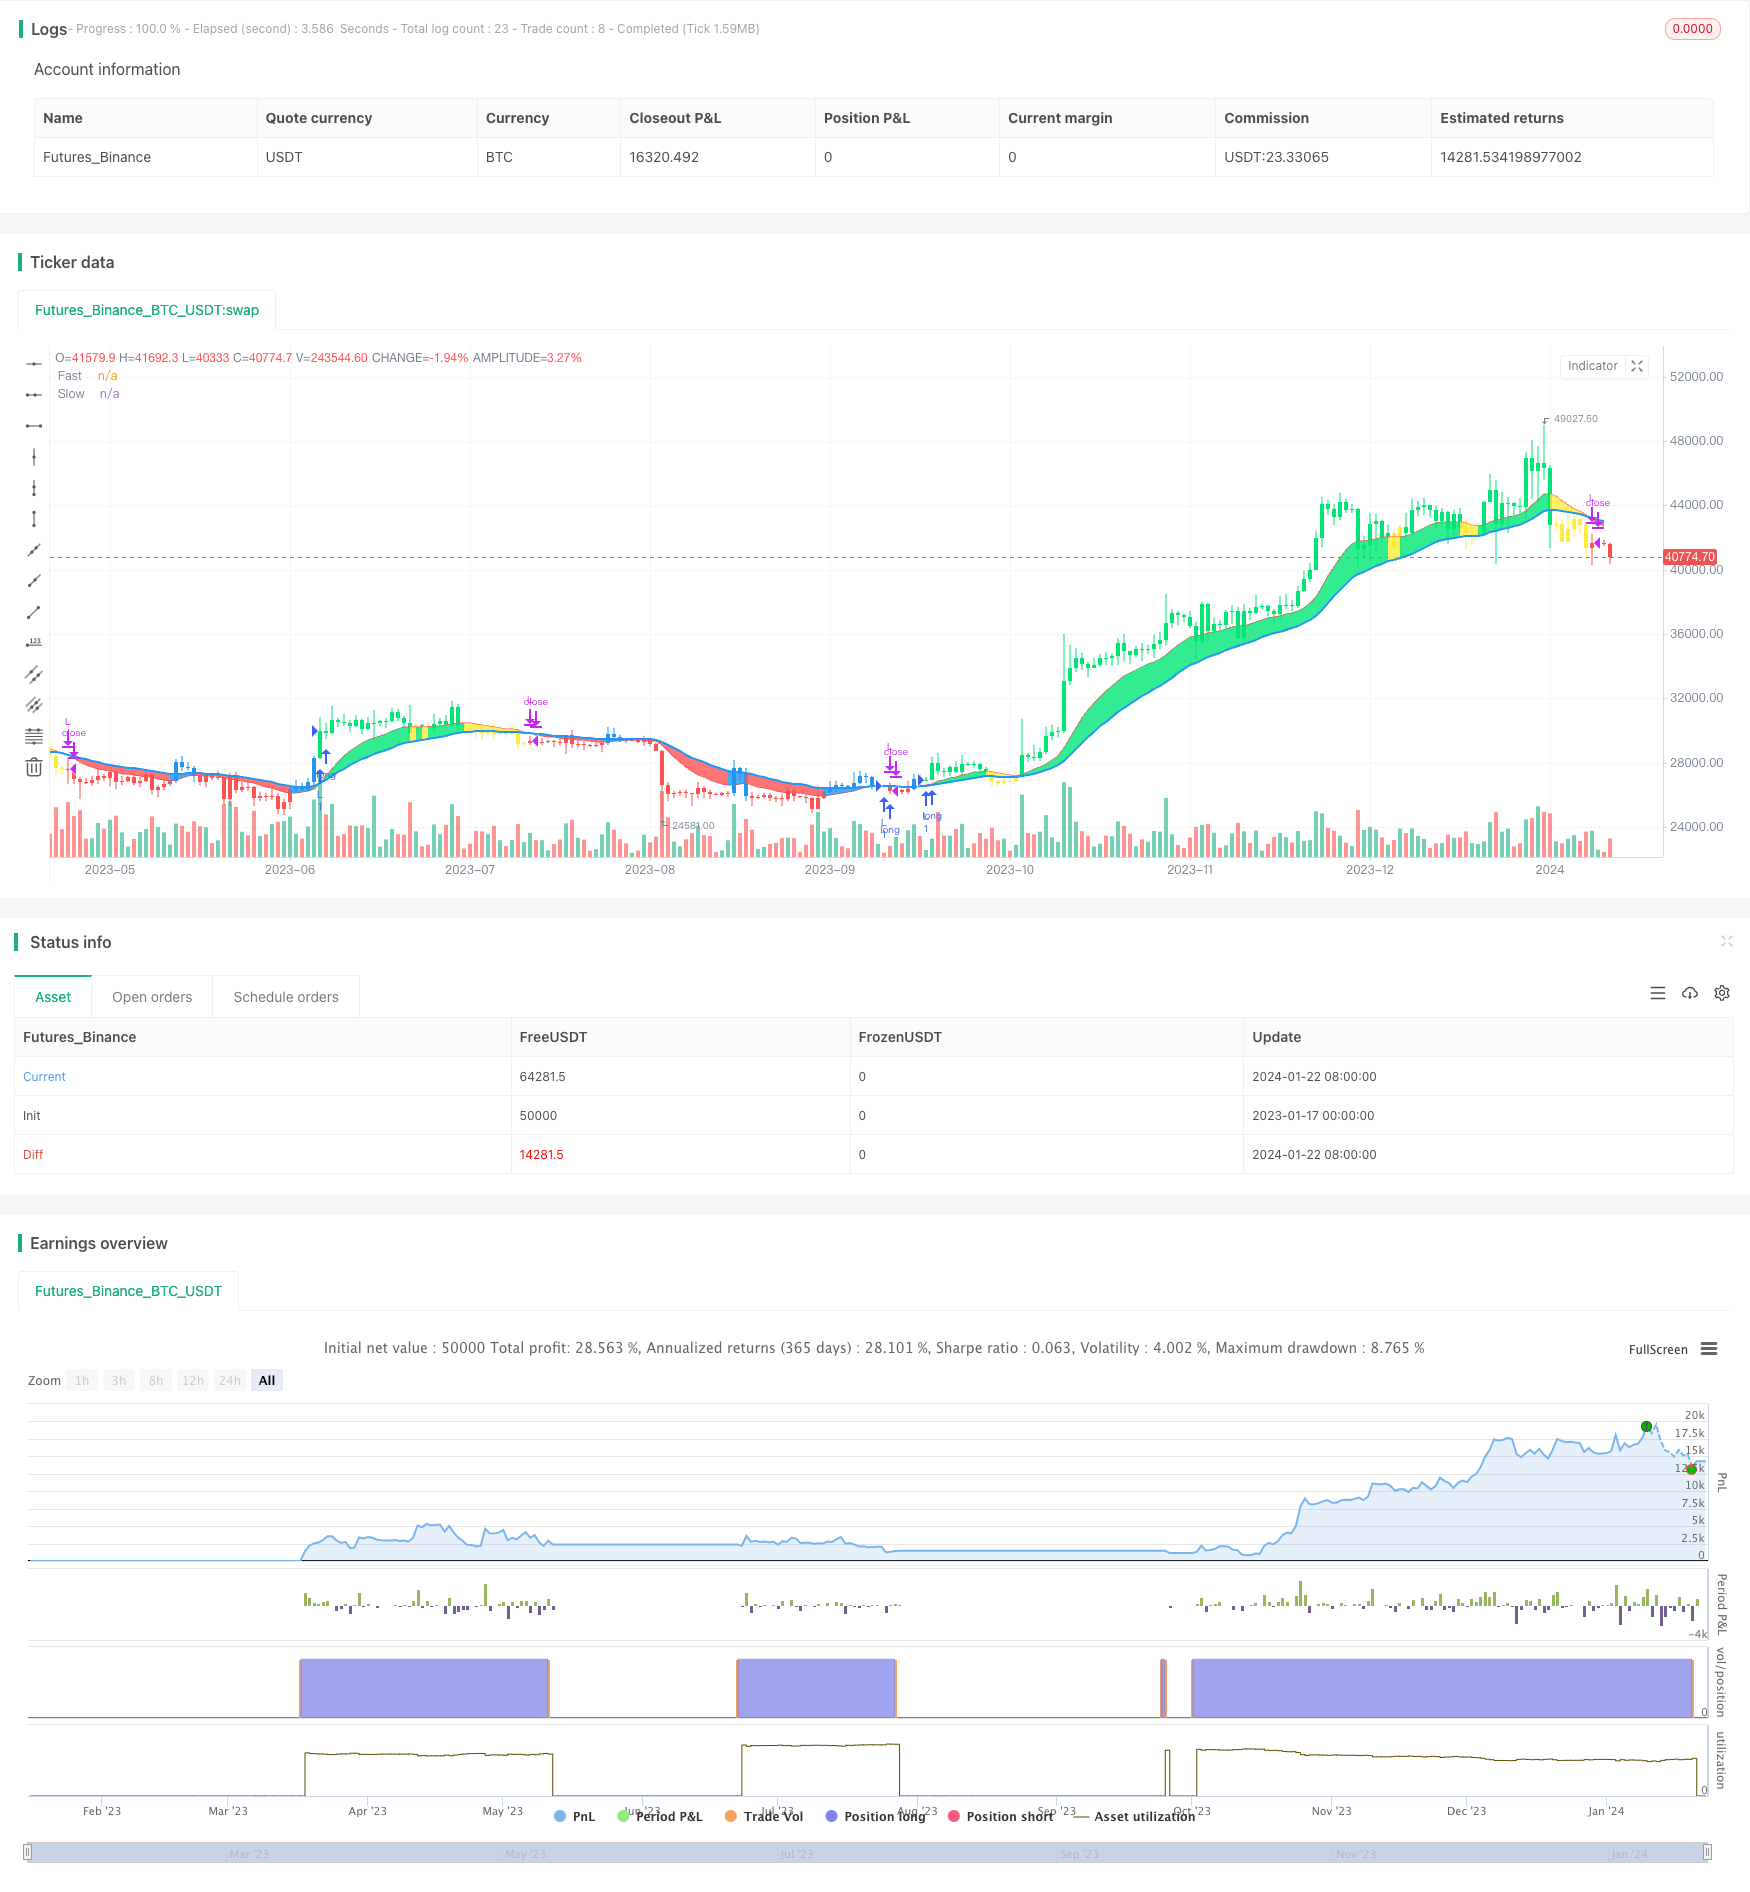
start: 2023-01-17 00:00:00
end: 2024-01-23 00:00:00
period: 1d
basePeriod: 1h
exchanges: [{"eid":"Futures_Binance","currency":"BTC_USDT"}]
*/
//@version=4
strategy("CDC Action Zone V.2", overlay=true)
// CDC ActionZone V2 29 Sep 2016
// CDC ActionZone is based on a simple 2MA and is most suitable for use with medium volatility market
// 11 Nov 2016 : Ported to Trading View with minor UI enhancement
LSB = input(title="Long/Short", defval="Long only", options=["Long only", "Short only" , "Both"])
src = input(title="Data Array",type=input.source,defval=ohlc4)
prd1=input(title="Short MA period", type=input.integer,defval=12)
prd2=input(title="Long MA period",type=input.integer,defval=26)
AP = ema(src,2)
Fast = ema(AP,prd1)
Slow = ema(AP,prd2)
Bullish = Fast>Slow
Bearish = Fast<Slow
Green = Bullish and AP>Fast
Red = Bearish and AP<Fast
Yellow = Bullish and AP<Fast
Blue = Bearish and AP>Fast
Buy = Bullish and Bearish[1]
Sell = Bearish and Bullish[1]
alertcondition(Buy,"Buy Signal","Buy")
alertcondition(Sell,"Sell Signal","Sell")
//Plot
l1=plot(Fast,"Fast", linewidth=1,color=color.red)
l2=plot(Slow,"Slow", linewidth=2,color=color.blue)
bcolor = Green ? color.lime : Red ? color.red : Yellow ? color.yellow : Blue ? color.blue : na
barcolor(color=bcolor)
fill(l1,l2,bcolor)
// === INPUT BACKTEST RANGE ===
FromYear = input(defval = 2000, title = "From Year", minval = 1920)
FromMonth = input(defval = 1, title = "From Month", minval = 1, maxval = 12)
FromDay = input(defval = 1, title = "From Day", minval = 1, maxval = 31)
ToYear = input(defval = 9999, title = "To Year", minval = 1921)
ToMonth = input(defval = 12, title = "To Month", minval = 1, maxval = 12)
ToDay = input(defval = 31, title = "To Day", minval = 1, maxval = 31)
// === FUNCTION EXAMPLE ===
start = timestamp(FromYear, FromMonth, FromDay, 00, 00) // backtest start window
finish = timestamp(ToYear, ToMonth, ToDay, 23, 59) // backtest finish window
window() => true // create function "within window of time"
if LSB == "Long only" and Buy and window()
strategy.entry("L",true)
if LSB == "Long only" and Sell and window()
strategy.close("L",qty_percent=100,comment="TP Long")
if LSB == "Both" and Buy and window()
strategy.entry("L",true)
if LSB == "Both" and Sell and window()
strategy.entry("S",false)
if LSB == "Short only" and Sell and window()
strategy.entry("S",false)
if LSB == "Short only" and Buy and window()
strategy.close("S",qty_percent=100,comment="TP Short")