概述
该策略主要利用相对强弱指标(RSI)与布林带进行交易信号判断。具体来说,是在RSI低位与布林带下轨交叉时做多,RSI高位与布林带上轨交叉时做空。
策略原理
该策略首先计算RSI指标和布林带。RSI指标反映交易品的相对强弱,当RSI低于超卖区(默认30)时代表交易品处于超卖区,此时买入。布林带包括上轨、中轨和下轨,能很好反映价格的波动范围。布林带下轨附近买入,上轨附近卖出,可以获取比较稳定的信号。该策略结合RSI指标与布林带进行交易信号判断,当RSI指标从超卖区上升到超卖区之上(默认30),并且价格从布林带下轨之下上升到布林带下轨之上时产生买入信号;当RSI指标从超买区下降到超买区之下(默认70),并且价格从布林带上轨之上下降到布林带上轨之下时产生卖出信号。
策略优势
- 结合RSI指标与布林带,提高信号判断准确性
- RSI指标过滤了部分噪音信号
- 布林带反映了目前市场波动的大体区间,信号比较可靠
- 交易策略较为严格,避免了无效交易的出现
策略风险
- 布林带参数设置不当可能会使交易信号不准确
- RSI超买超卖区参数设置不合适也可能影响信号判断
- 策略较为严格,可能会错过部分交易机会
风险解决方法: 1. 对布林带参数和RSI参数进行优化,找到最佳参数组合 2. 适当放宽策略的交易条件,增加一定量的无效交易以获取更多机会
策略优化方向
- 对RSI参数和布林带参数进行测试与优化,找到最优参数
- 增加止损策略,以控制交易风险
- 考虑加入其它技术指标进行信号验证,如MACD等
- 测试不同品种和时间周期的参数优化效果
总结
该策略整体较为稳健,有效地结合了RSI指标和布林带止损。通过对参数的测试与优化,可以进一步提高策略的效果。同时也需要警惕由于策略较为严格可能带来的信号漏失风险。总的来说,该策略为一可靠的量化交易策略。
策略源码
/*backtest
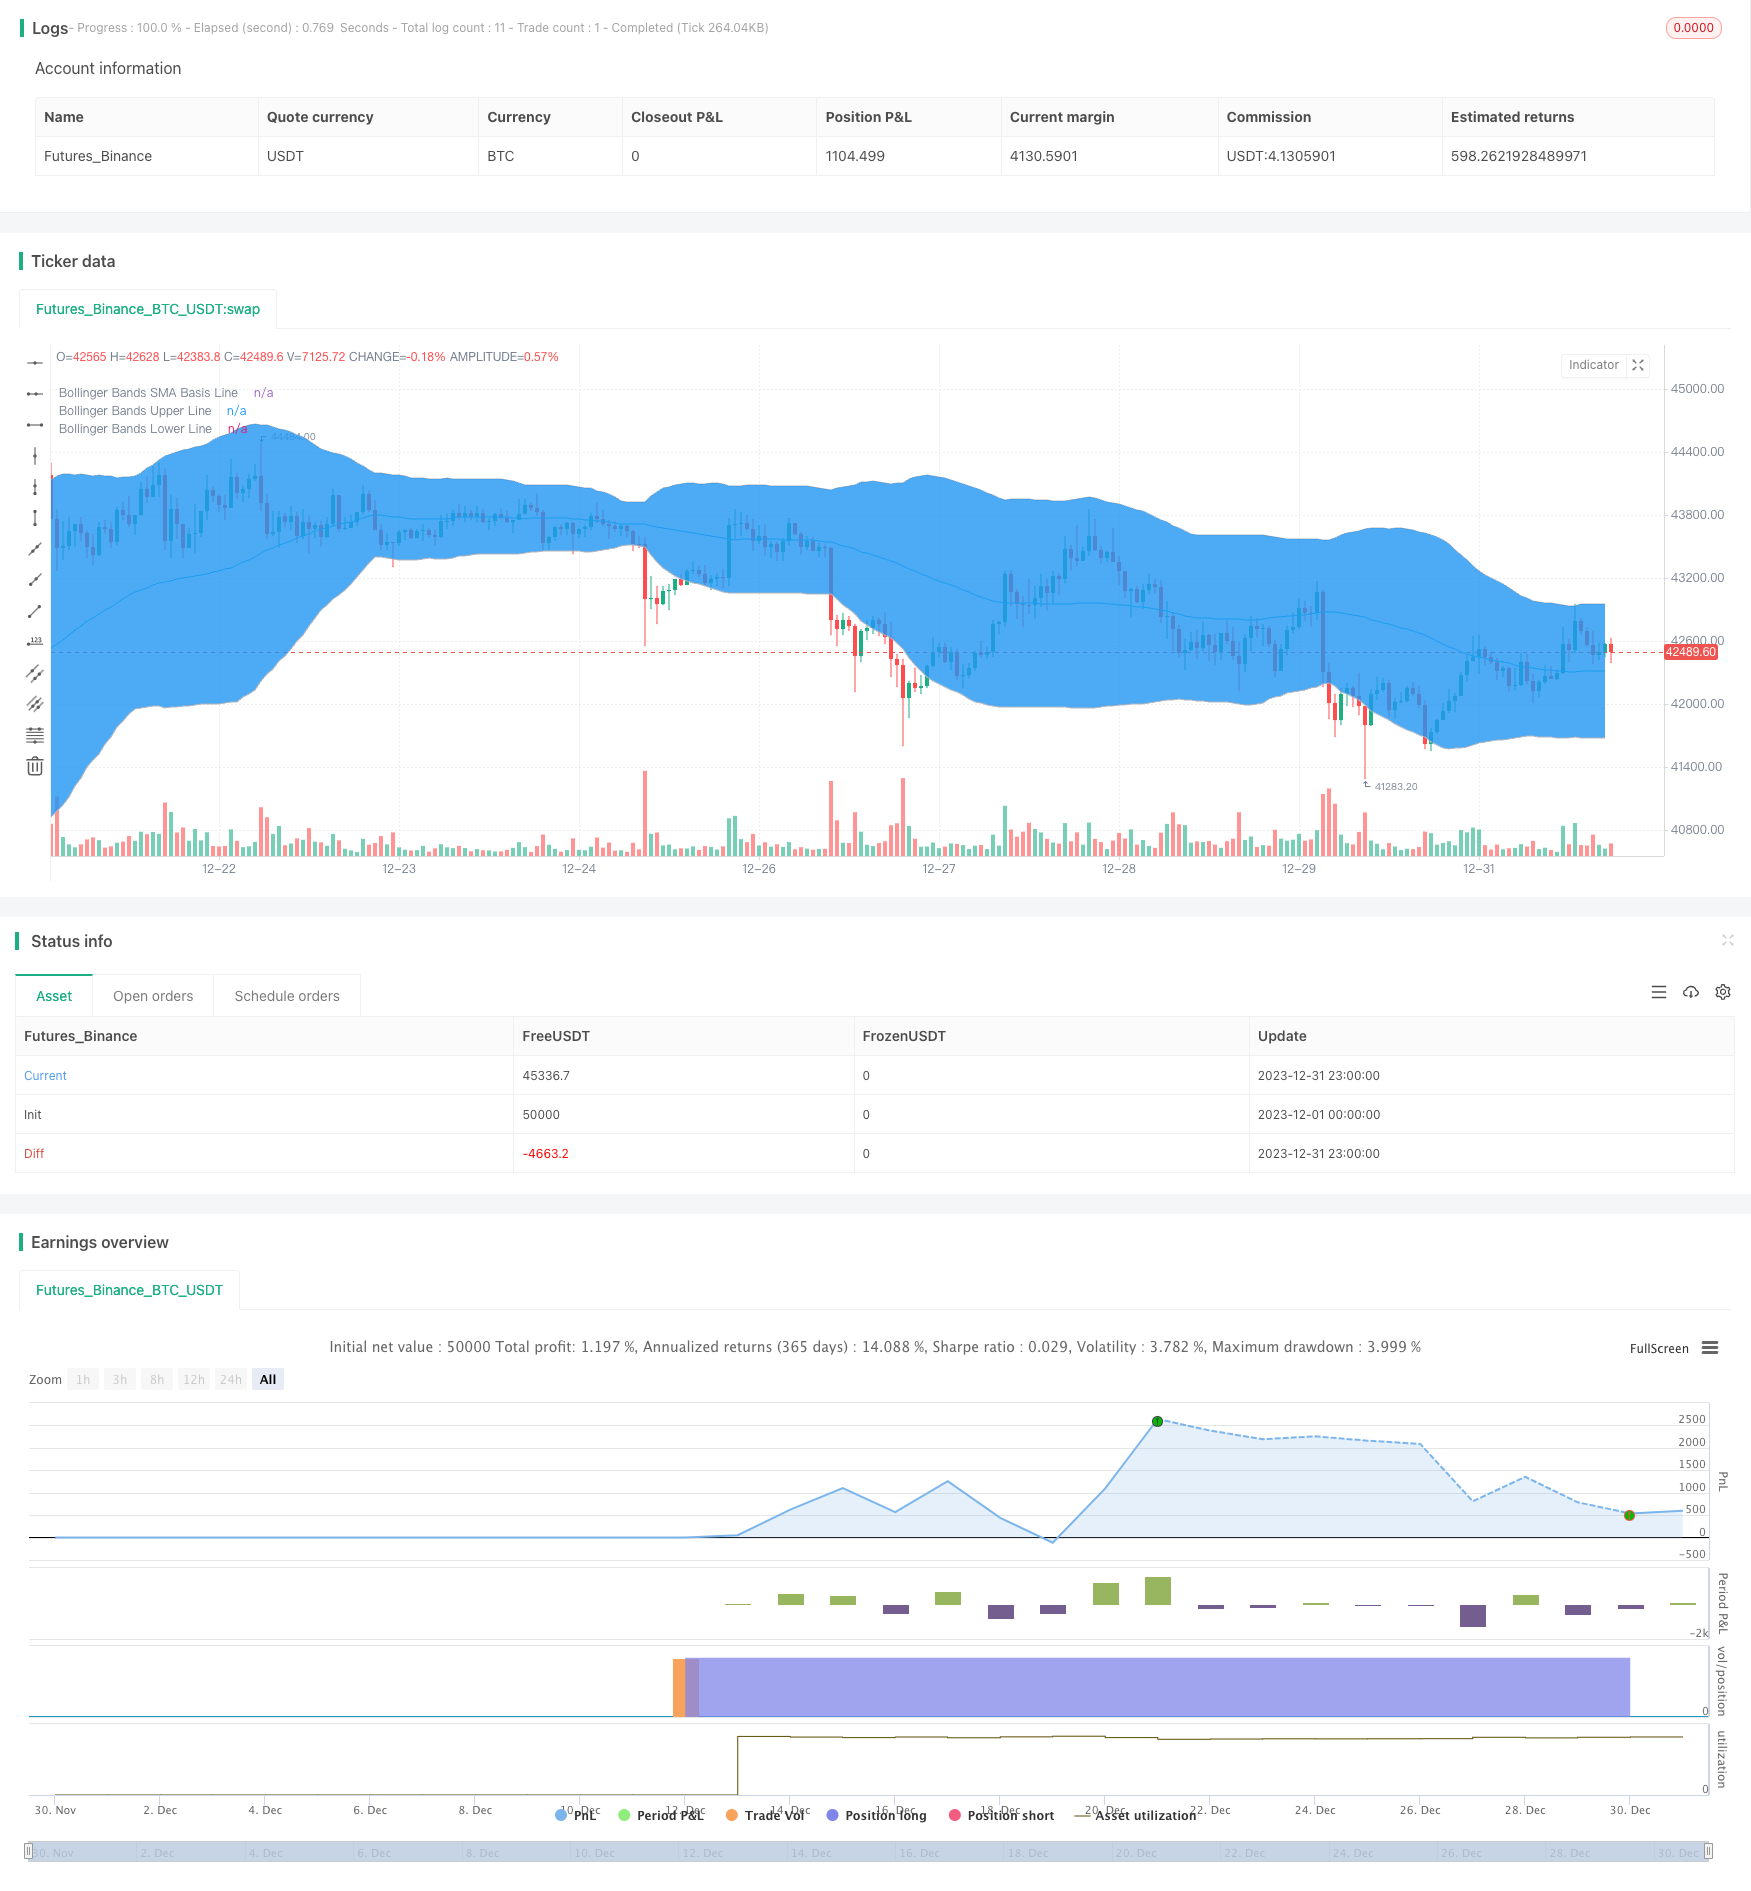
start: 2023-12-01 00:00:00
end: 2023-12-31 23:59:59
period: 1h
basePeriod: 15m
exchanges: [{"eid":"Futures_Binance","currency":"BTC_USDT"}]
*/
//@version=2
strategy("BB + RSI 20MIN,", shorttitle="BBRSI 20MIN", overlay=true )
// Strategy Tester Start Time
sYear = input(2019, title = "Start Year")
sMonth = input(04, title = "Start Month", minval = 01, maxval = 12)
sDay = input(01, title = "Start Day", minval = 01, maxval = 31)
sHour = input(00, title = "Start Hour", minval = 00, maxval = 23)
sMinute = input(00, title = "Start Minute", minval = 00, maxval = 59)
startTime = true
///////////// RSI
RSIlength = input(9,title="RSI Period Length")
RSIoverSold = input(30, minval=1,title="RSIL")
RSIoverBought = input(69, minval=1,title="RSIh")
price = open
vrsi = rsi(price, RSIlength)
///////////// Bollinger Bands
BBlength = input(60, minval=1,title="Bollinger Period Length")
BBmult = input(2.0, minval=0.001, maxval=50,title="Bb")
BBbasis = sma(price, BBlength)
BBdev = BBmult * stdev(price, BBlength)
BBupper = BBbasis + BBdev
BBlower = BBbasis - BBdev
source = close
buyEntry = crossover(source, BBlower)
sellEntry = crossunder(source, BBupper)
plot(BBbasis, color=aqua,title="Bollinger Bands SMA Basis Line")
p1 = plot(BBupper, color=silver,title="Bollinger Bands Upper Line")
p2 = plot(BBlower, color=silver,title="Bollinger Bands Lower Line")
fill(p1, p2)
///////////// Colors
switch1=input(true, title="Enable Bar Color?")
switch2=input(true, title="Enable Background Color?")
TrendColor = RSIoverBought and (price[1] > BBupper and price < BBupper) and BBbasis < BBbasis[1] ? red : RSIoverSold and (price[1] < BBlower and price > BBlower) and BBbasis > BBbasis[1] ? green : na
barcolor(switch1?TrendColor:na)
bgcolor(switch2?TrendColor:na,transp=50)
///////////// RSI + Bollinger Bands Strategy
if (not na(vrsi))
if (crossover(vrsi, RSIoverSold) and crossover(source, BBlower))
strategy.entry("RSI_BB_L", strategy.long and startTime, stop=BBlower, comment="RSI_BB_L")
else
strategy.cancel(id="RSI_BB_L")
if (crossunder(vrsi, RSIoverBought) and crossunder(source, BBupper))
strategy.entry("RSI_BB_S", strategy.short and startTime, stop=BBupper,comment="RSI_BB_S")
else
strategy.cancel(id="RSI_BB_S")
//plot(strategy.equity, title="equity", color=red, linewidth=2, style=areabr)