Moving Average Crossover Trading Strategy

Overview
The moving average crossover trading strategy is a relatively common quantitative trading strategy. This strategy generates trading signals by calculating moving averages of different periods and according to their crossover situations. Specifically, it calculates the exponential moving averages (EMA) of 4 periods, 8 periods and 20 periods. When the short-term EMA crosses above the long-term EMA, go long; when the short-term EMA crosses below the long-term EMA, go short.
Strategy Logic
The core logic of this strategy is:
- Calculate the EMA lines of 4 periods, 8 periods and 20 periods.
- Judge the relationship between the 4-period EMA line and the 8-period EMA line:
- When the 4-period EMA line crosses above the 8-period EMA line, it means the price trend is strengthening, which is a bullish signal.
- When the 4-period EMA crosses below the 8-period EMA, it means the price trend is weakening, which is a bearish signal.
- At the same time, judge the direction of the 20-period EMA line:
- If the 20-period EMA line goes up, then Enter Long.
- If the 20-period EMA line goes down, then Enter Short.
- When the relationship between the 4-period EMA line and the 8-period EMA line reverses, Prepare Exit.
- When the direction of the 20-period EMA line reverses, Exit Now.
Through this method, we take advantage of the crossover between different period moving averages to judge market signals, and use the direction of the longest period moving average to filter false signals, constructing a stable trading strategy.
Advantages of the Strategy
The main advantages of this strategy are:
- The strategy logic is simple and clear, easy to understand and implement.
- The double condition filtering can reduce false signals.
- The boost from 20-period EMA can identify major trends and enhance stability.
- Customizable parameters to adjust trading frequency.
- Easy to combine with other indicators or models to build complex strategies.
Risks of the Strategy
There are also some risks with this strategy:
- Double moving average strategies tend to generate false signals.
- Fixed periods cannot adapt to market changes.
- It’s easy to cause losses during market fluctuations.
The main solutions are:
- Appropriately shorten the holding period and stop loss in time.
- Dynamically optimize parameters and adjust moving average periods.
- Combine with other indicators or models to create complex strategies.
Optimization Directions
The strategy can be optimized in the following aspects:
-
Period optimization: Determine the optimal MA period combination according to different varieties.
-
Stop loss optimization: Reasonably set stop loss points to control single loss.
-
Parameter optimization: Dynamically optimize parameters using genetic algorithms, Markov chains, etc.
-
Model fusion: Integrate with LSTM, RNN and other deep learning models to extract more Alpha.
-
Portfolio optimization: Combine with other technical indicator strategies to construct strategy portfolios.
Summary
In general, the moving average crossover strategy is a relatively classic and commonly used quantitative trading strategy. This strategy has simple logic and is easy to understand and implement, with certain stability. But there are also some problems, such as generating false signals, inability to adapt to market changes, etc. These issues can be improved through parameter optimization, stop loss optimization, model fusion, and other methods. Overall, the moving average strategy can be used as a basic module in the strategy toolbox, combined with more complex strategies to build robust complex strategies.
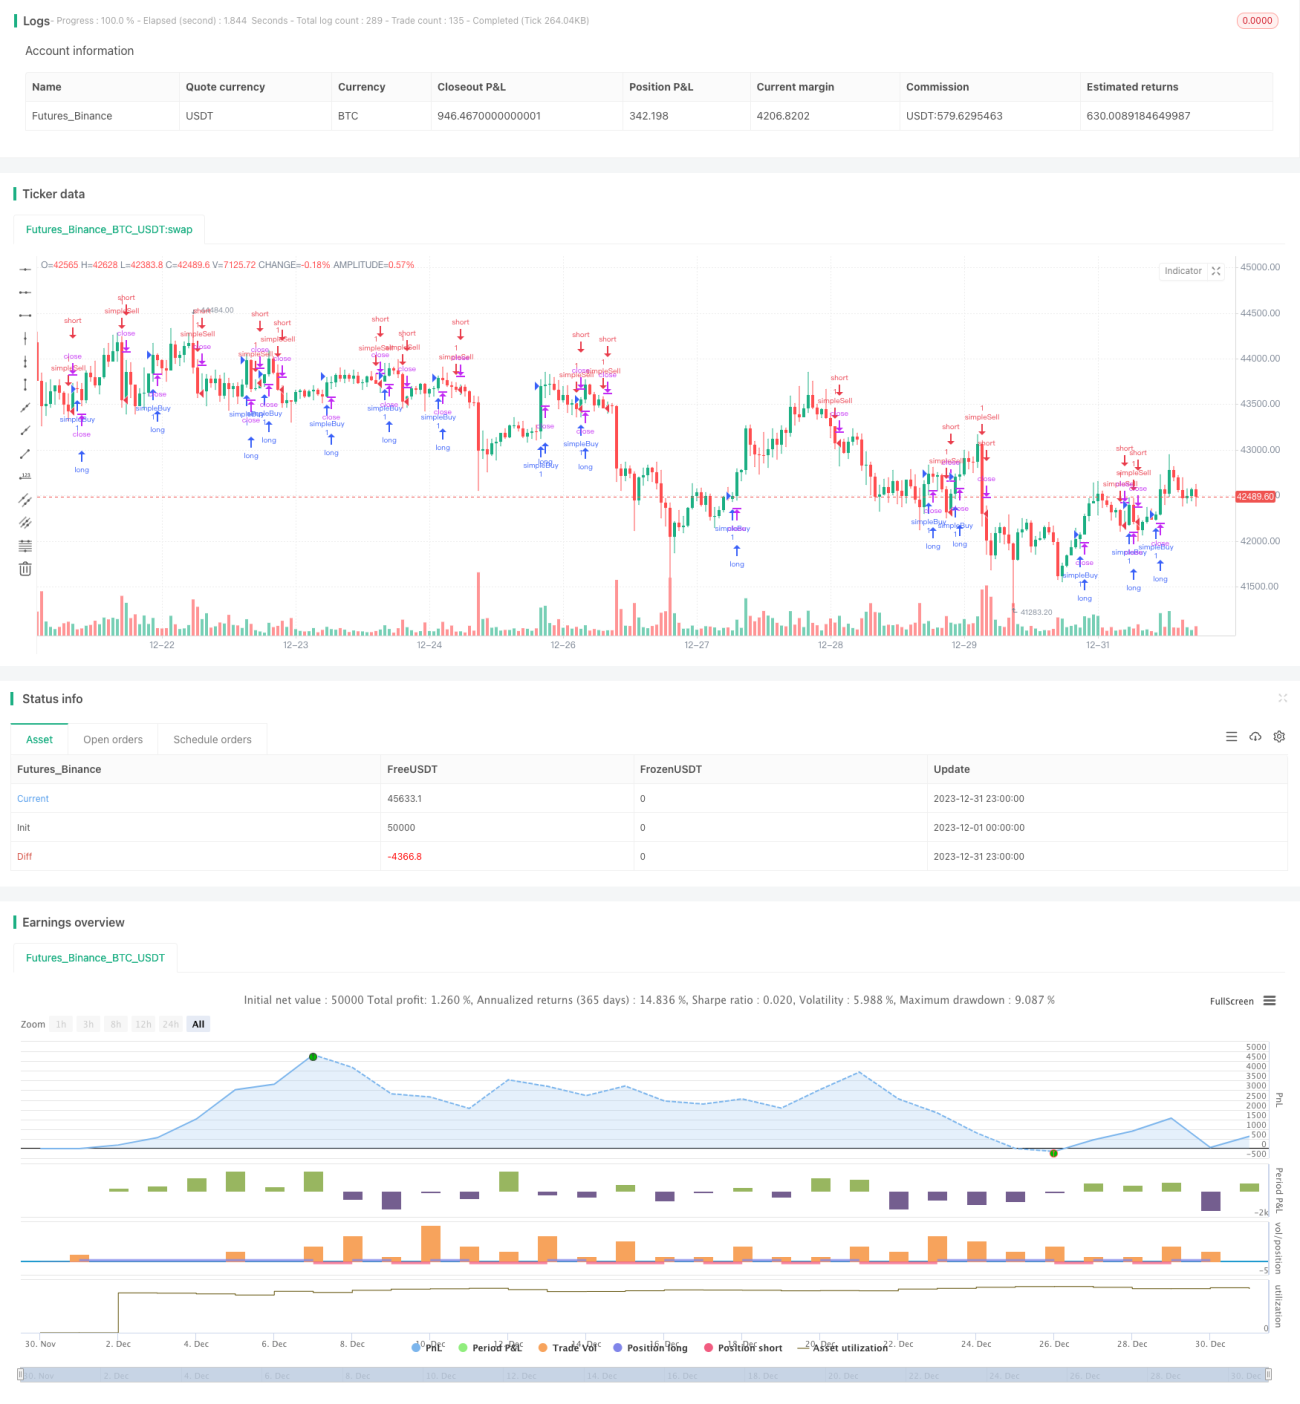
/*backtest
start: 2023-12-01 00:00:00
end: 2023-12-31 23:59:59
period: 1h
basePeriod: 15m
exchanges: [{"eid":"Futures_Binance","currency":"BTC_USDT"}]
*/

//@version=3
//future strategy
//strategy(title = "stub", default_qty_type = strategy.fixed, default_qty_value = 1,  overlay = true, commission_type=strategy.commission.cash_per_contract,commission_value=2.05)
//stock strategy- 1