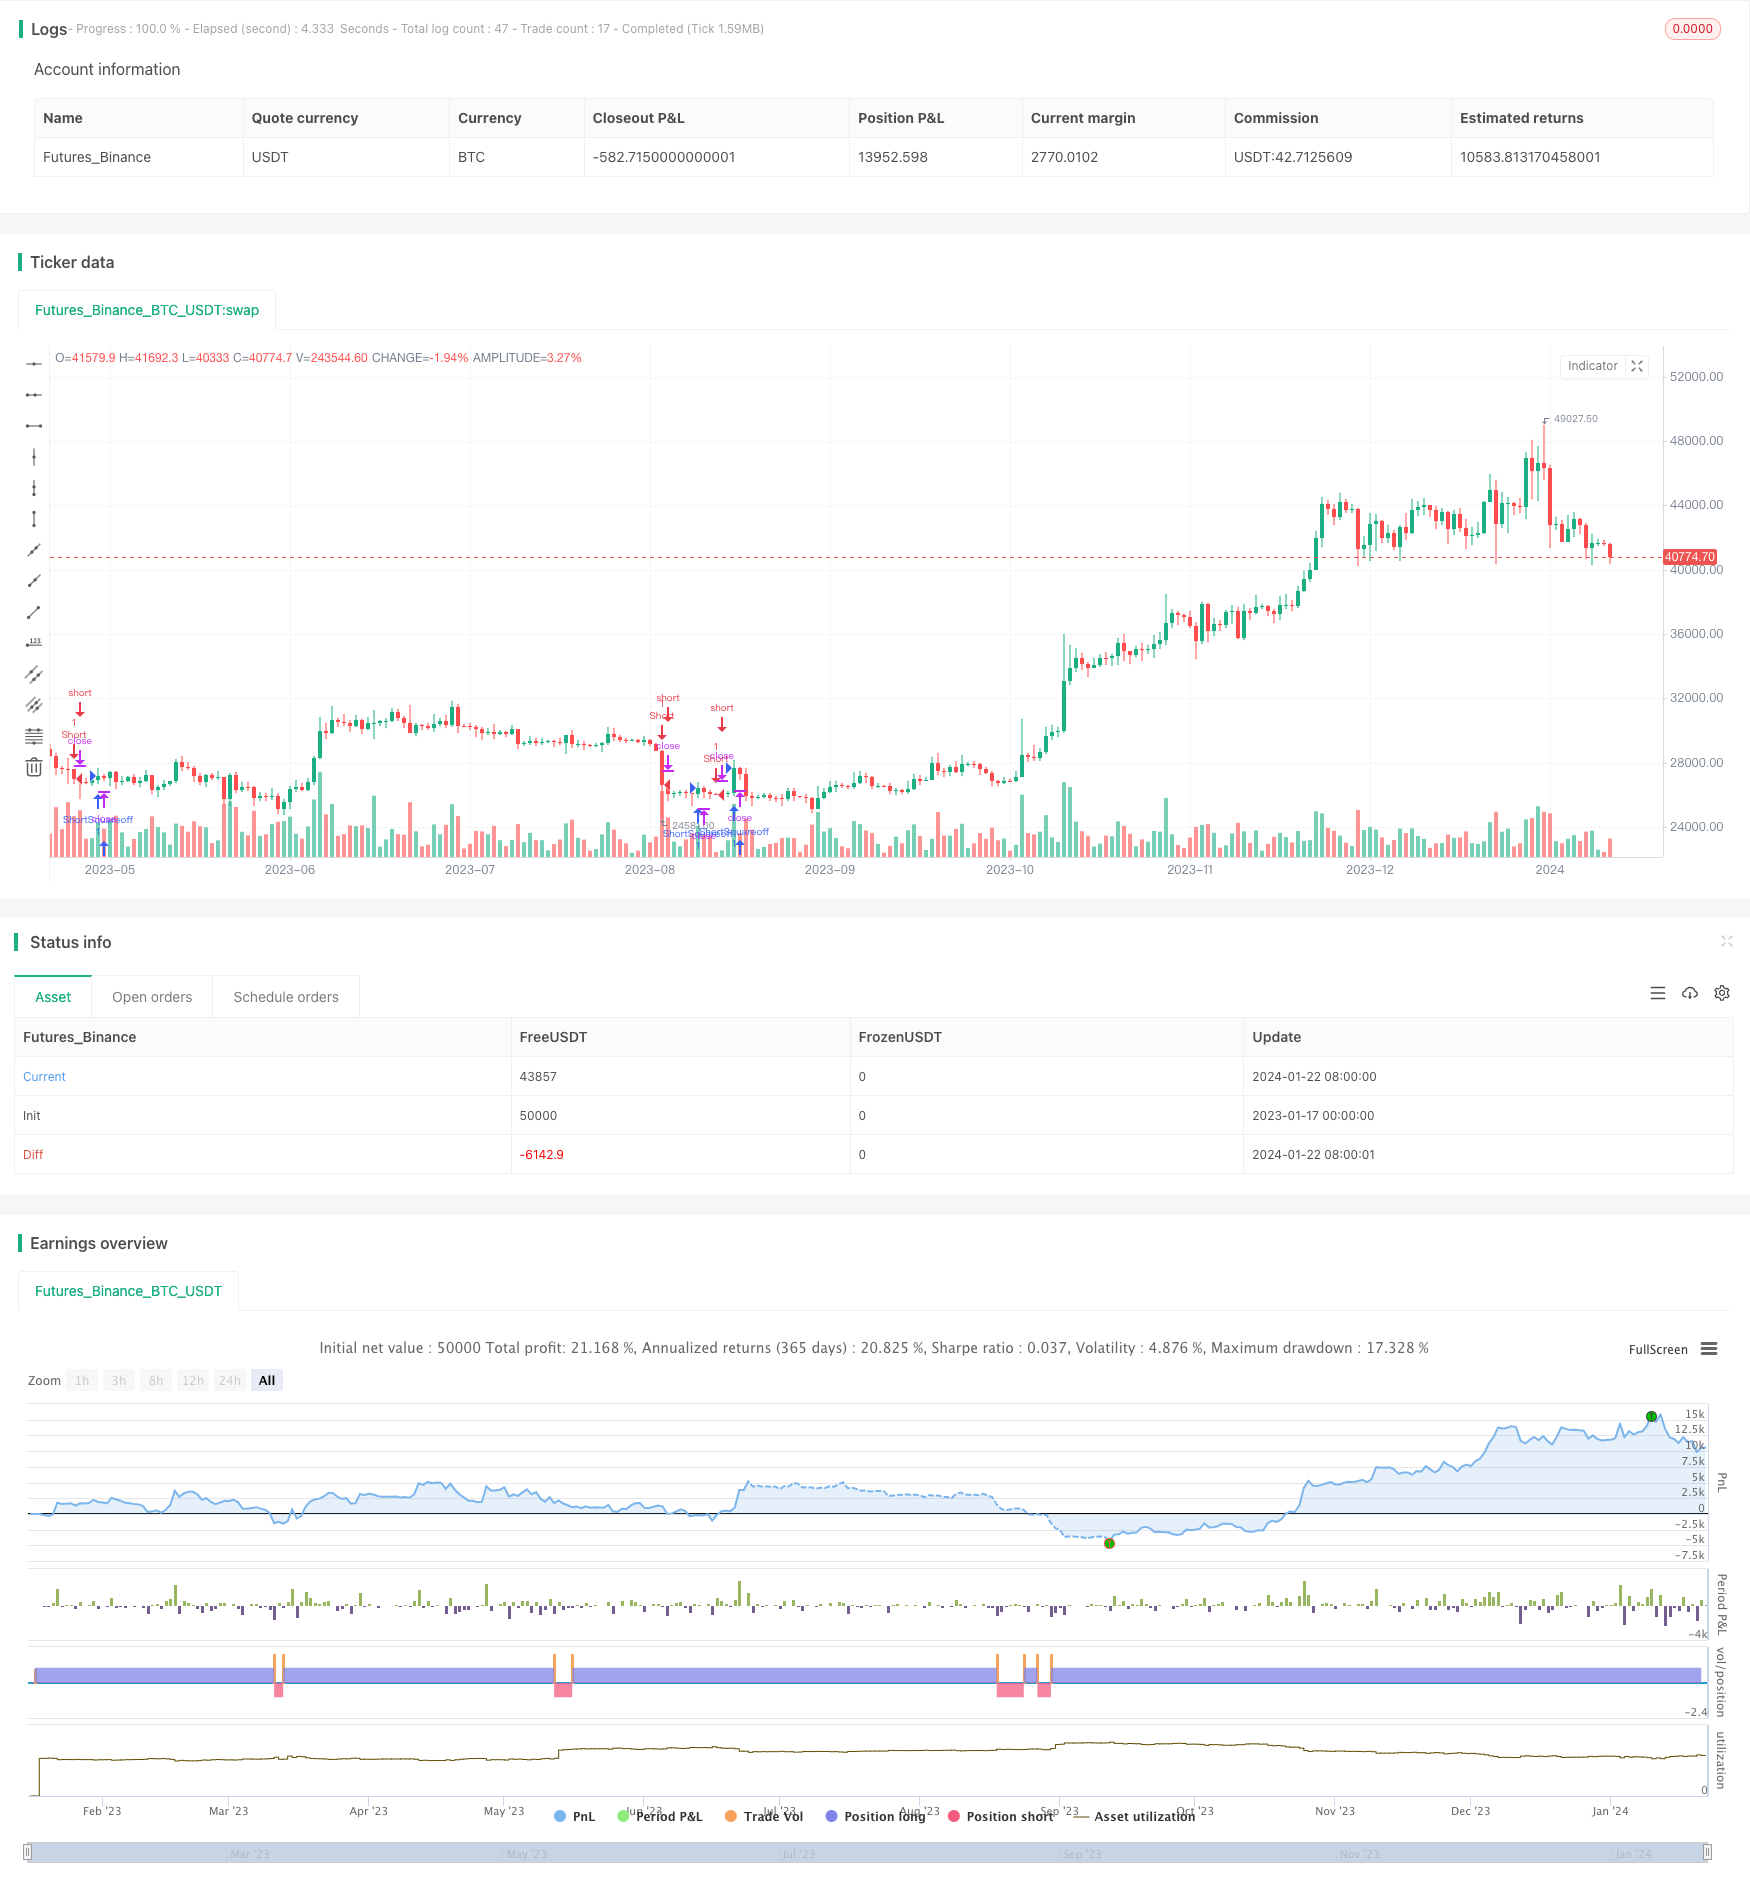
概述
该策略通过结合多个技术指标对Bank Nifty的短期趋势进行判断,以发出买入或卖出信号。主要运用的技术指标有MACD、RSI、ADX、Stochastic和布林带。策略名称为“BankNifty_Bearish_Intraday”,表示其主要用于判断Bank Nifty的短期bearish趋势。
策略原理
该策略的核心逻辑是,当MACD、RSI、ADX、Stochastic和布林带等多个指标同时显示超卖信号时,发出做空信号;当五根K线收盘价上穿五日线时,发出平仓信号。
具体而言,MACD的5分钟、15分钟和60分钟均要低于其上一根K线,表示三个时间周期上趋势向下;RSI低于40表示超卖;ADX高于12表示趋势开始形成;Stochastic %K下穿%D表示动量向下;布林带下轨下穿表示波动加大。当这些指标同时符合时,发出做空信号。
Position的平仓信号则是当5分钟K线收盘价上穿5日均线时,表示短期趋势可能反转,此时平掉头寸。
通过组合多个时间周期上的K线指标,可以更准确判断短期趋势,过滤掉部分噪音。同时设置止损平仓点,可以控制单笔交易的风险。
优势分析
该策略最大的优势在于指标组合全面,可以准确判断短期趋势,特别适合高频交易。具体优势有:
结合多时间周期指标,判断更加准确;
设置止损点,可以限制单笔交易损失;
交易频次较高,适合积极的短线交易者。
风险分析
该策略的主要风险在于指标组合过于复杂,可能出现信号不一致的情况。此外,高频交易虽然单笔损失有限,但整体交易次数较多,手续费会比较高。主要风险包括:
- 信号出现不一致,买卖点判断失误的可能;
- 高频交易,手续费成本较高;
- 需密切监控市场,不能马虎。
为了应对这些风险,我们可以适当简化指标组合,调整止损位置,并控制每次交易资金占用比例。
优化方向
该策略可以从以下几个方向进行优化:
- 调整指标参数,优化买卖信号的准确性;
2.增加其他辅助判断指标,如交易量指标,确保足够的趋势信心;
3.设置动态止损,根据市场波动程度做调整;
4.加入跨周期分析,判断关键支撑阻力;
5.根据波动性和风险管理规则,制定一个头寸规模策略。
通过测试不同的参数设定、增加判断维度等优化,可以使该策略更稳定可靠。
总结
该短期交易策略通过单根K线多指标组合判断,实现高频出入场。优点是准确抓住短期动能,风险得到控制;缺点是复杂的信号,高额的佣金费用. 我们可以通过调整参数、加入更多辅助判断、设置动态止损、跨周期分析等方法进行优化,使策略更实用。总体来说,该策略为积极的短线交易者提供了一个快速出入场的思路,值得借鉴学习。
/*backtest
start: 2023-01-17 00:00:00
end: 2024-01-23 00:00:00
period: 1d
basePeriod: 1h
exchanges: [{"eid":"Futures_Binance","currency":"BTC_USDT"}]
*/

// This source code is subject to the terms of the Mozilla Public License 2.0 at https://mozilla.org/MPL/2.0/
// © makarandpatil

// This strategy is for Bank Nifty instrument and for intraday purpose only
// It checks for various indicators and gives a sell signal when all conditions are met
// Bank Nifty when in momentum gives 100-200 points in spot in 5-15 min which is how long the trade duration should be
// Issues - The custom script as per TradingView Pinescripting has an issue of repaint
// More information on repainting issue in this link - https://www.tradingview.com/pine-script-docs/en/v5/concepts/Repainting.html
// Use the script alert only to get notified, however check all the parameters individually before taking the trade
// Also, please perform a backtesting and deep backtesting of this strategy to see if the strategy gave correct buy signals in the past
// The script is made for testing purposes only and is in beta mode. Please use at own risk.


//@version=5
strategy("BankNifty_Bearish_Intraday", overlay=true, margin_long=100, margin_short=100)

// Variables
StochLength = input(14, title="Stochastic Length")
smoothK = input(3, title="%K Smoothing")
smoothD = input(3, title="%D Smoothing")

//INDICATOR CALCULATIONS

// 1. MACD
[macdLine, signalLine, histLine] = ta.macd(close[0],12,26,9)
macd5 = request.security(syminfo.tickerid, "5", macdLine)
macd15 = request.security(syminfo.tickerid,"15",macdLine)
macd60 = request.security(syminfo.tickerid,"60",macdLine)

// 2. RSI Calculation
xRSI = ta.rsi(close, 14)

// 3. ADX calculation
[diplus, diminus, adx] = ta.dmi(14,14)

// 4. Stochastic Calculation
k = ta.sma(ta.stoch(close, high, low, StochLength), smoothK)
d = ta.sma(k, smoothD)

// 5. Bollinger Band calculation
[middle, upper, lower] = ta.bb(close, 20, 2)

//CONDITIONS

// 1. Conditions for MACD
macd5Downtick = macd5[0] < macd5[1]
macd15Downtick = macd15[0] < macd15[1]
macd60Downtick = macd60[0] <= macd60[1]

// 2. Condition for xRSI
RSIWeak = xRSI < 40

// 3. Condition for ADX
ADXUngali = adx >= 12

// 4. Condition for Stochastic
StochNCO = k < d

// 5. Condition for Bollinger Band
BBCD = lower < lower [1]

//Evaluate the short condition
shortCondition = macd5Downtick and macd15Downtick and macd60Downtick and RSIWeak and ADXUngali and StochNCO and BBCD
// shortCondition = macd5Downtick and macd15Downtick and RSIWeak and ADXUngali and StochNCO
if (shortCondition)
    strategy.entry("Short", strategy.short, alert_message = "BankNifty_Sell_Momentum")

longCondition = close > ta.ema(close,5)
if (longCondition)
    strategy.entry("ShortSquareoff", strategy.long, alert_message = "BankNifty_Closed_Above_5EMA")