Multi-indicator Combined Quantitative Trading Strategy

Author: ChaoZhang, Date: 2024-01-24 15:10:41
Tags:

img

Overview

This strategy uses three technical indicators of stock price, RSI, StochRSI and Bollinger Bands, and combines trading time and direction conditions to determine buy and sell signals for quantitative trading strategies.

Principle

When the RSI indicator is less than the lower area and the StochRSI K line crosses above the D line, it is considered a buy signal. At the same time, the stock price is cheaper than the lower line of the Bollinger Band or crosses below the lower line of the Bollinger Band is also used as a basis for buying.

When the RSI indicator exceeds the upper area and the StochRSI K line crosses below the D line, it is considered a sell signal. At the same time, the stock price is higher than the upper line of the Bollinger Band or breaks through the upper line of the Bollinger Band is also used as the basis for selling.

The RSI indicator judges whether the stock price is overbought or oversold, StochRSI judges the momentum of the stock price, and Bollinger Bands judges whether the stock price is running at high levels and cheap. Multiple indicators combine to determine buying and selling.

Advantage Analysis

This is a multi-indicator combined strategy with wide coverage of indicators and comprehensive judgment basis. Crossing is required between the current stock price or indicator and its threshold before judging the signal, which has a certain filtering effect on false signals.

Time condition restrictions are added before placing orders to avoid greater risks during specific time periods.

By combining the judgments of multiple indicators, more types of trends can be matched to improve the effectiveness of the strategy.

Risk Analysis

The strategy relies mainly on three types of indicators. If the indicator gives a wrong signal, the strategy will cause losses. Indicators should verify each other and cannot completely rely on a certain indicator. For example, RSI oscillation in a certain period of time will increase the possibility of issuing false signals.

The time judgment conditions added in the strategy may also miss favorable market conditions.

If the stock selection is inappropriate, for example, stocks with severe exaggeration effects, the validity of these indicators will be greatly reduced. The applicability of stocks to these indicators should be studied.

Optimization

  1. Increase risk control measures such as maximum drawdown to limit losses.

  2. Adjust the parameters of the indicator to better match the selected stocks. For example, speed up the RSI parameters to detect faster price changes.

  3. Increase filtering mechanisms, such as suspend trading when the stock price is in the middle of the Bollinger Band to avoid oscillating market conditions. And stop ordering near opening and closing to avoid gap risk.

  4. Stock selection can refer to fundamentals to avoid stocks with serious financial fraud. Industry and market value judgments can also be added to select large-cap stocks.

Summary

This is a typical multi-variable technical indicator strategy with a balanced mix of indicators and extensive coverage. At the same time, the order conditions are rigorous, which can effectively select stocks to achieve profit, and the drawdown will be controlled within a certain range. Through the optimization of indicators and parameters, it can better adapt to the market. At the same time increase risk control mechanism to minimize risk to further improve the stability and reliability of the strategy.


/*backtest
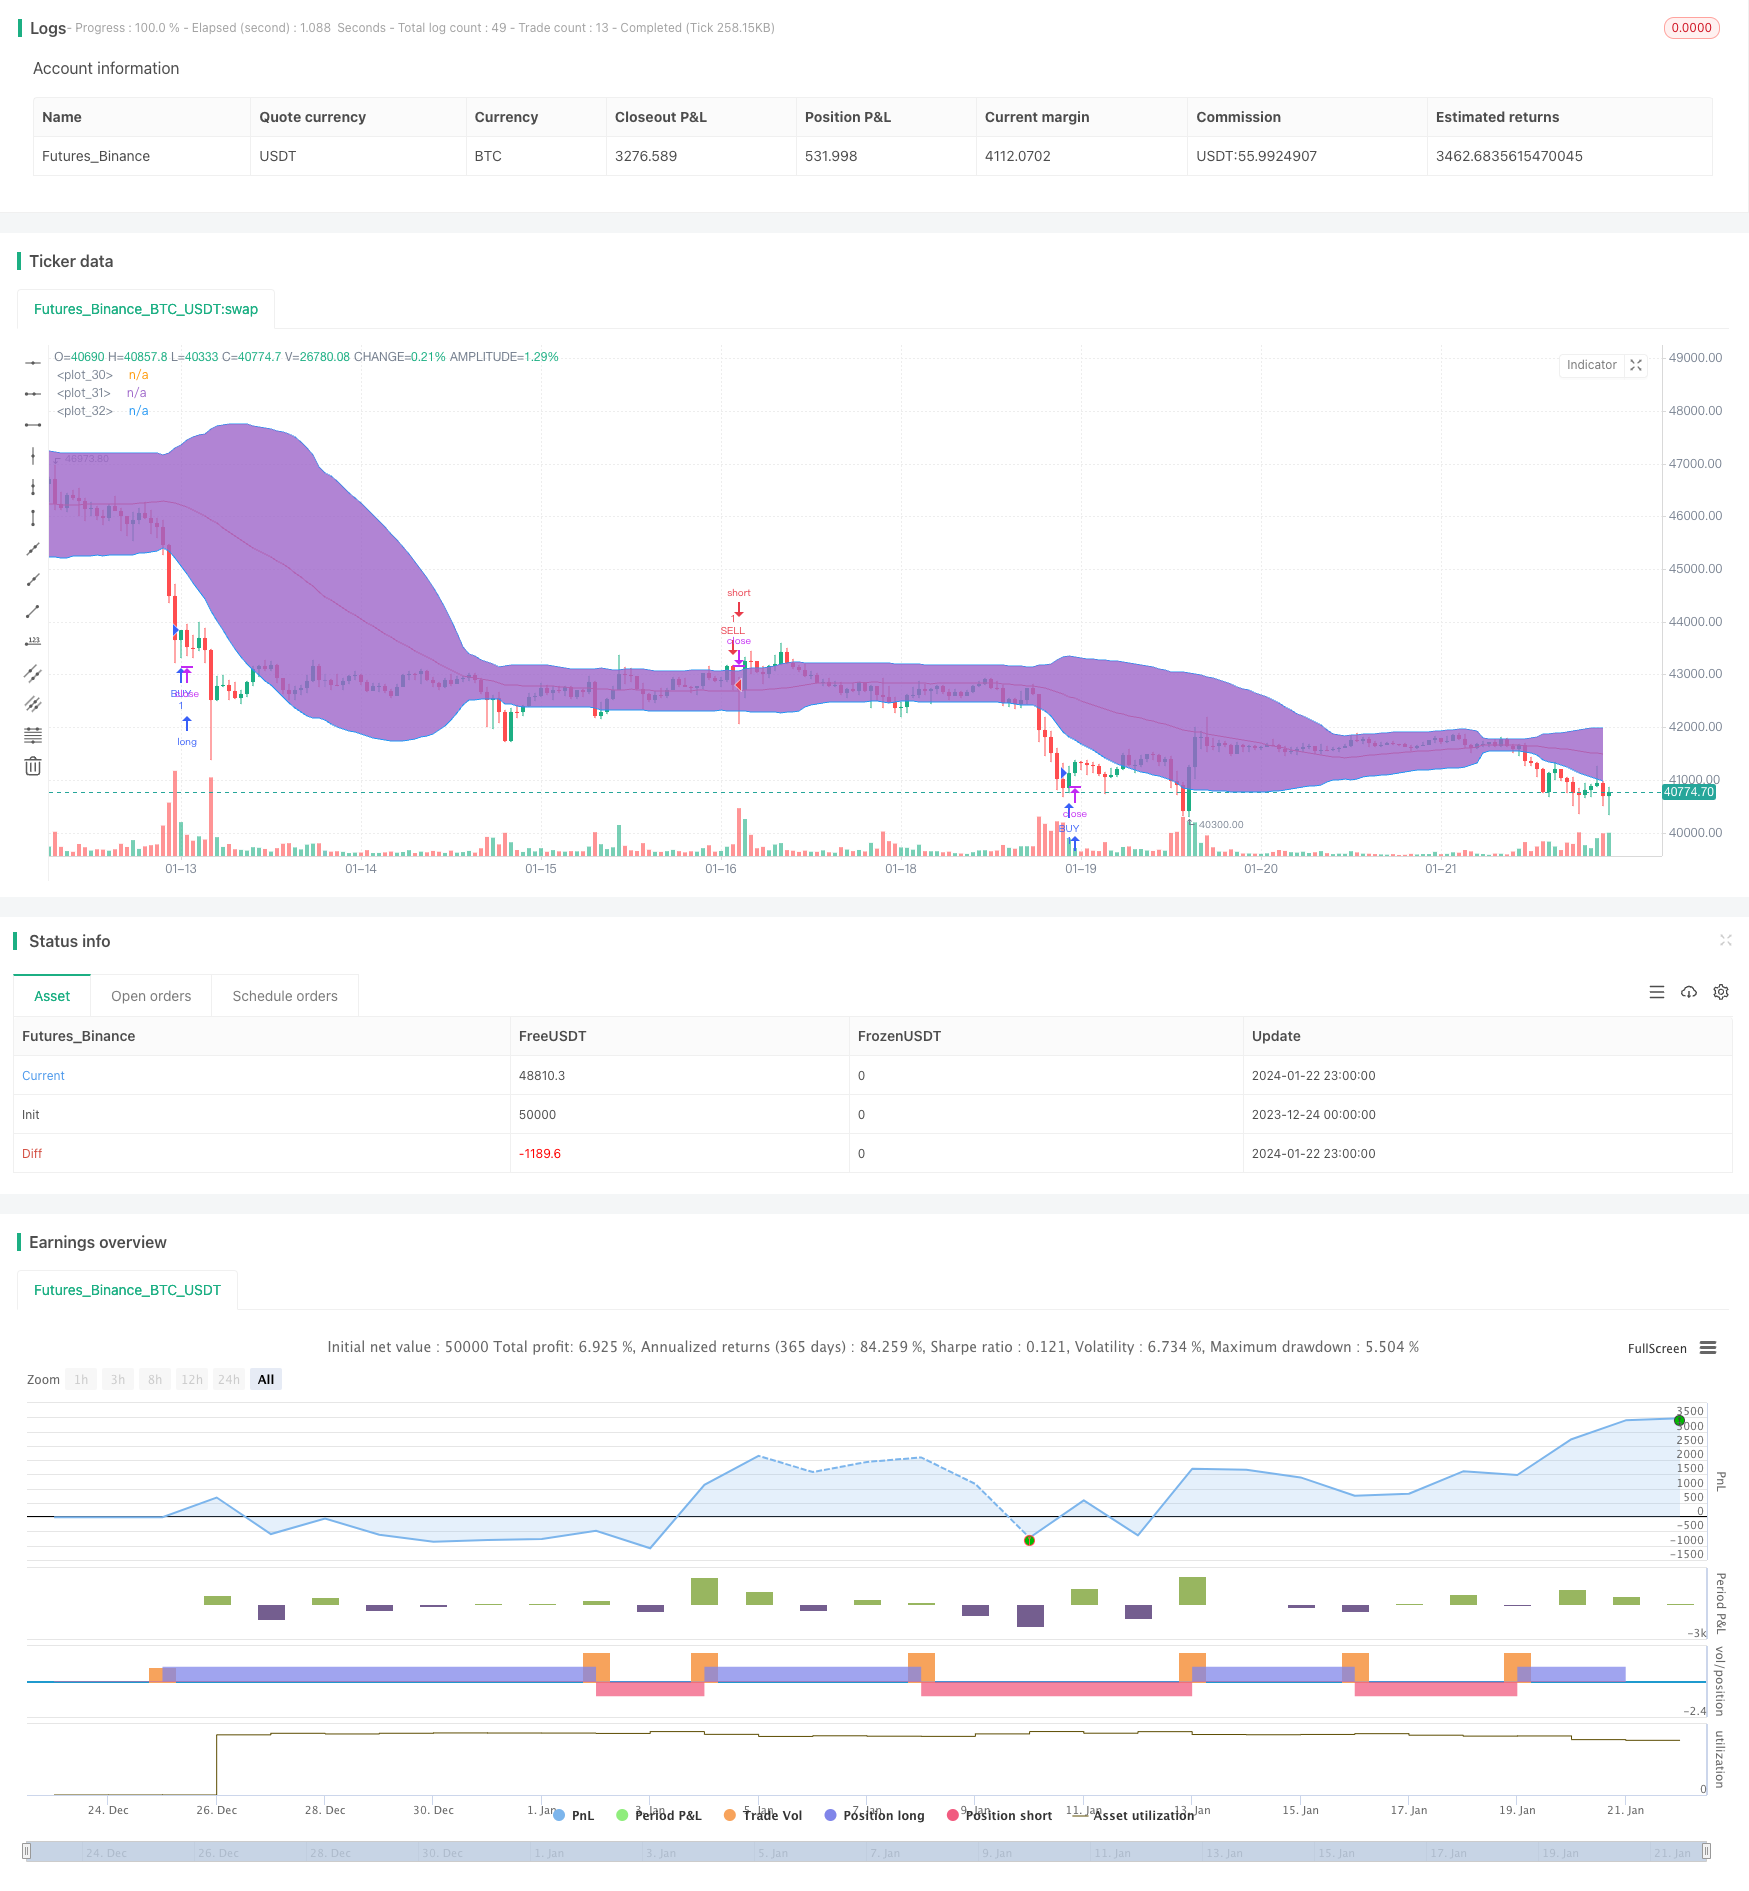
start: 2023-12-24 00:00:00
end: 2024-01-23 00:00:00
period: 1h
basePeriod: 15m
exchanges: [{"eid":"Futures_Binance","currency":"BTC_USDT"}]
*/

//@version= 2
strategy("RSI+STOCHRSI+BB Strategy", overlay=true)
lengthrsi = input(6)
overSold = input( 20 )
overBought = input( 70 )
price = close
vrsi = rsi(price, lengthrsi)

smoothK = input(3, minval=1)
smoothD = input(3, minval=1)
lengthRSI = input(14, minval=1)
lengthStoch = input(14, minval=1)
src = input(close, title="RSI Source")

rsi1 = rsi(src, lengthRSI)
k = sma(stoch(rsi1, rsi1, rsi1, lengthStoch), smoothK)
d = sma(k, smoothD)

bblength = input(50)
bbupmult =input(1.5,title="Multiplier for BB Upper Band")
bblowmult = input(1.5,title="Multiplier for BB Lower Band")

basis =  sma(close,bblength)

devup = bbupmult * stdev(close, bblength)
devlow = bblowmult * stdev(close, bblength)

upper = basis + devup
lower = basis - devlow
plot(basis, color=red)
p1 = plot(upper, color=blue)
p2 = plot(lower, color=blue)
fill(p1, p2)


yearfrom = input(2018)
yearuntil =input(2019)
monthfrom =input(6)
monthuntil =input(12)
dayfrom=input(1)
dayuntil=input(31)


if (  ( crossover(k,d)) and ( crossover(vrsi,overSold) or vrsi<overSold)  and (  (price<lower) or crossover(price,lower) ) ) 
    strategy.entry("BUY", strategy.long, stop=close, oca_name="TREND",  comment="BUY")
    
else
    strategy.cancel(id="BUY")


if ( ( crossunder(k,d) ) and ( (vrsi >overBought) or crossunder(vrsi,overBought) ) and  ( (price>upper) or crossunder(price,upper) )) 

    strategy.entry("SELL", strategy.short,stop=close, oca_name="TREND",  comment="SELL")
else
    strategy.cancel(id="SELL")


More