概述
本策略通过结合相对强弱指数(RSI)和指数移动平均线(EMA)这两个技术指标,实现了一个基于趋势跟踪的量化交易策略。该策略主要适用于趋势性市场,通过在识别到价格可能反转的时机进场,跟踪趋势获利。
策略原理
指标选择
- EMA用于判断当前趋势方向。策略中使用了20日线、50日线和200日线三条EMA。当价格高于这三条EMA时,我们判断目前处于牛市趋势。
- RSI用于判断是否处于超买超卖状态。标准参数14的RSI,超买线为70,超卖线为30。
入场规则
看涨入场信号: - RSI低于30阈值,表示处于超卖状态,价格可能反弹上涨 - 价格高于20日线、50日线、200日线中的任意一条,表示目前处于趋势向上阶段
当同时满足以上两个条件时,我们做多入场。
风险控制
每一笔交易,我们限制最大可能损失为账户净值的3%。具体设置Stop Loss点的位置需要结合市场的特点。
入场时计算持仓规模:最大损失额/(入场价 - Stop Loss价) = 持仓规模
这样可有效控制单笔交易的风险。
出场规则
平仓信号主要有以下几种情况:
- RSI超过70阈值,表明股价可能因超买而下跌
- 价格下破20日线、50日线或200日线的任意一条,表示趋势反转
满足以上条件时我们平仓离场。
优势分析
该策略结合了趋势跟踪和反转交易的优点。通过EMA判断大趋势方向,再在超卖区反转的时机进场,既可以跟踪趋势又有反转的机会,增强策略稳定性。同时,RSI指标的参数可调,可以针对不同市场进行优化,适应性强。
风险控制方面,每笔交易限制最大损失,可以有效控制单笔交易的风险,保护账户资金。
风险分析
该策略主要适合趋势性比较明显的市场,如果遇到复杂多变的市场,使用EMA判断趋势效果可能会打折扣。此外,RSI指标存在一定的滞后,需要结合价格实际走势进行分析。
停损点的设置对策略的盈亏很关键,需要根据不同市场谨慎测试来设定。如果停损点设定过大,单笔损失可能扩大;如果停损点过小,可能被市场噪音止损。这方面需要实盘观察来不断优化。
优化方向
可以尝试优化RSI的参数,适应更多市场环境。可以测试不同的持仓规模比例,找到最优的设置。可以测试加入其他技术指标,构建更稳健的入场和出场系统。这些都是可以尝试的优化方向。
总结
该策略整合趋势跟踪和反转交易的优点,在判断大趋势的同时,在可能反转点进入市场。运用RSI等指标参数的优化,可以适应更多市场环境。每笔交易风险可控,适合中长期稳定运营。同时策略可进一步优化,根据不同市场和风格进行调整测试。
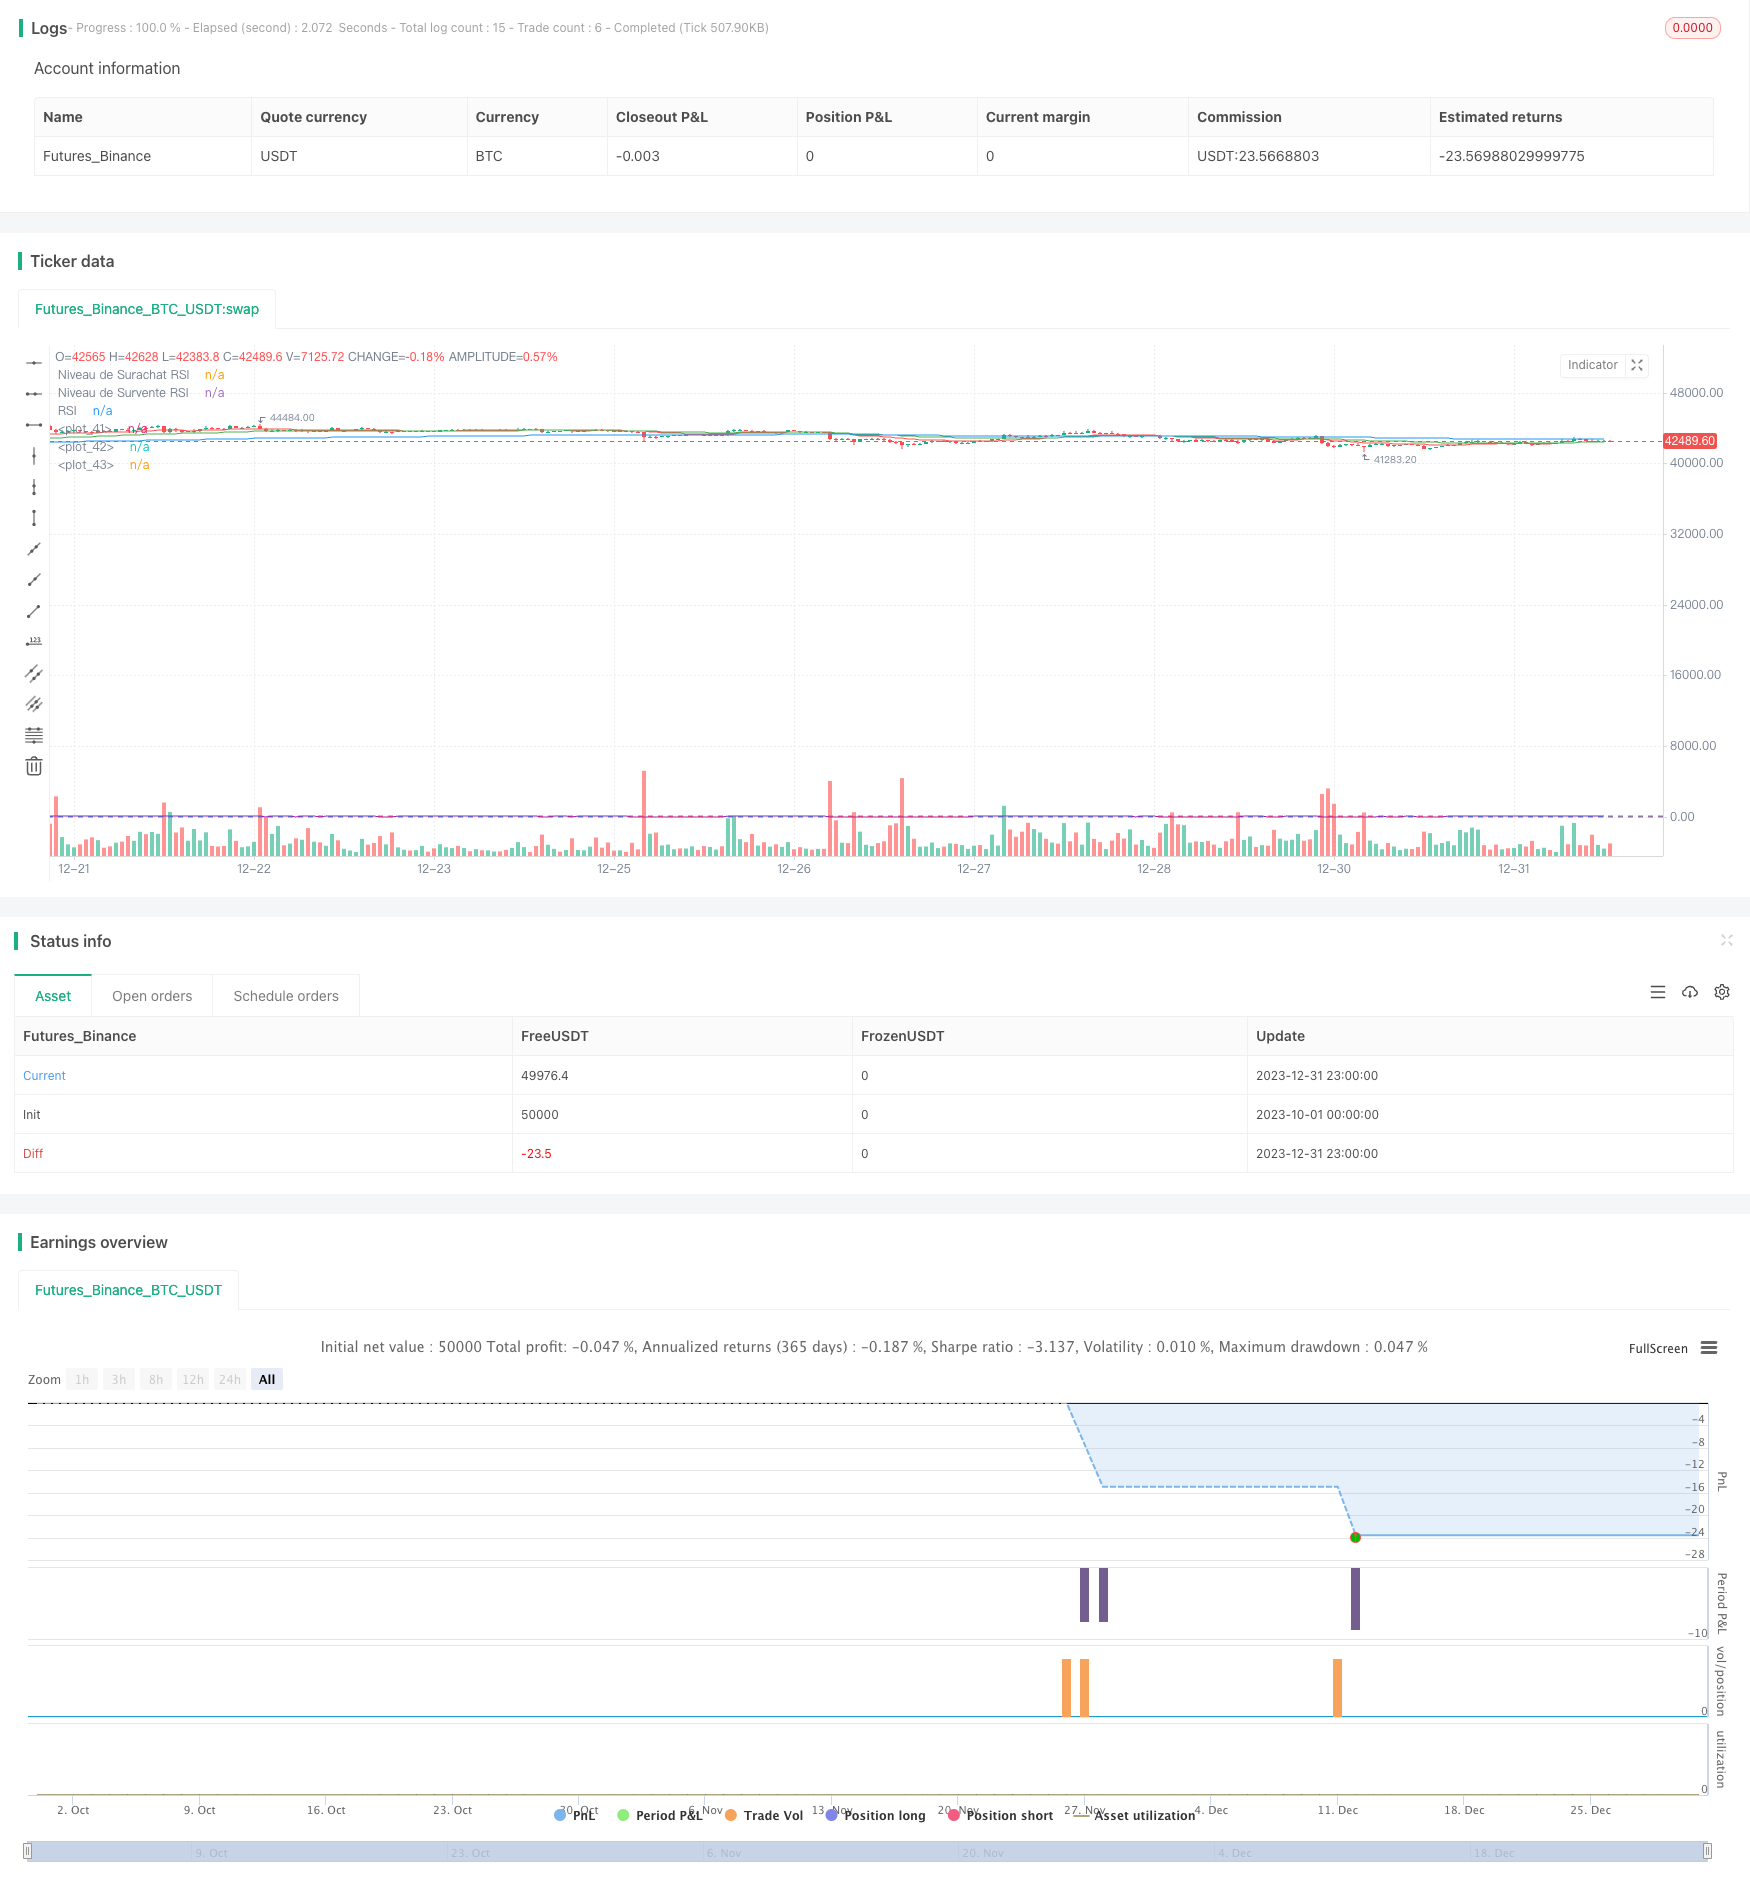
/*backtest
start: 2023-10-01 00:00:00
end: 2023-12-31 23:59:59
period: 1h
basePeriod: 15m
exchanges: [{"eid":"Futures_Binance","currency":"BTC_USDT"}]
*/

//@version=4
strategy("Stratégie RSI et EMA avec Gestion du Risque", overlay=true)

// Paramètres de la stratégie
rsiLength = input(14, "Longueur du RSI")
rsiOverbought = input(70, "Niveau de Surachat RSI")
rsiOversold = input(30, "Niveau de Survente RSI")

// Calcul du RSI
rsiValue = rsi(close, rsiLength)

// Paramètres des EMA
ema20 = ema(close, 20)
ema50 = ema(close, 50)
ema200 = ema(close, 200)

// Paramètre du risque par trade
riskPerTrade = input(0.03, "Risque par Trade (3%)")

// Distance du stop-loss en pips (à ajuster selon votre stratégie)
stopLossPips = input(1, "Distance du Stop-Loss en pips")

// Calcul de la taille de position et du stop-loss
calculatePositionSize(entryPrice, stopLossPips) =>
    stopLossPrice = entryPrice - stopLossPips * syminfo.mintick
    riskPerTradeValue = strategy.equity * riskPerTrade
    positionSize = riskPerTradeValue / (entryPrice - stopLossPrice)
    positionSize

// Conditions d'entrée
longCondition = (rsiValue < rsiOversold) and (close > ema20 or close > ema50 or close > ema200)
if longCondition
    strategy.entry("Long", strategy.long, qty=1)

// Conditions de sortie
exitCondition = (rsiValue > rsiOverbought) or (close < ema20 or close < ema50 or close < ema200)
if exitCondition
    strategy.close("Long")

// Affichage des EMA et RSI sur le graphique
plot(ema20, color=color.red)
plot(ema50, color=color.green)
plot(ema200, color=color.blue)
hline(rsiOverbought, "Niveau de Surachat RSI", color=color.red)
hline(rsiOversold, "Niveau de Survente RSI", color=color.blue)
plot(rsiValue, "RSI", color=color.purple)