概述
本策略基于相对强弱指数(RSI)指标,设计了一个用于Nifty指数交易的量化投资策略。该策略利用RSI指标识别超买超卖机会,实现低买高卖,追求超额收益。
策略原理
该策略设置2期RSI作为交易信号。当RSI上穿20时,做多;当RSI下穿70时,平仓。这样可以捕捉指数的短期调整机会。
具体原理是:当RSI低于20时,属于超卖状态,表示资产被低估,预示着即将反弹;当RSI上穿20时,做多;当RSI高于70时,属于超买状态,表示资产被高估,预示着即将回调;当RSI下穿70时,平仓。
优势分析
这是一个利用指标识别短期超买超卖机会的量化策略。相比复杂的机器学习和统计套利策略,该策略优势主要体现在:
- 原理简单清晰,容易理解和验证
- 指标参数少,容易优化和调整
- 追求短期超额收益,符合穿越交易理念
- 可自定义交易时间段,适应不同期望
风险分析
该策略主要存在以下风险:
- 无法应对长期趋势,容易错失大行情
- 过于依赖参数优化,可能存在过拟合风险
- 无止损机制,无法有效控制亏损
- 交易频繁,影响持仓时间,产生更多交易费用
为控制上述风险,可以从以下几个方面进行优化:
- 结合趋势等指标,识别长期行情
- 采用Walk Forward Analysis方法防止过拟合
- 设置止损点,及时止损
- 适当调整交易参数,控制交易频率
优化方向
该策略主要可从以下几个方面进行优化:
- 优化RSI参数,寻找最优参数组合
- 增加止损机制,控制最大回撤
- 结合移动均线等指标,判断长期趋势
- 增加仓位管理模块,优化仓位分配
- 增加量化copyright功能,自动调整参数
总结
本策略基于RSI指标设计了一个短期交易策略,利用RSI指标的超买超卖信号实现低买高卖,追求超额收益。该策略原理简单,易于实现,但存在一定程度交易频繁,无法识别长期趋势等问题。未来可从优化RSI参数、增加止损机制、结合趋势判断等方面进行改进,使策略更稳定可靠。
策略源码
/*backtest
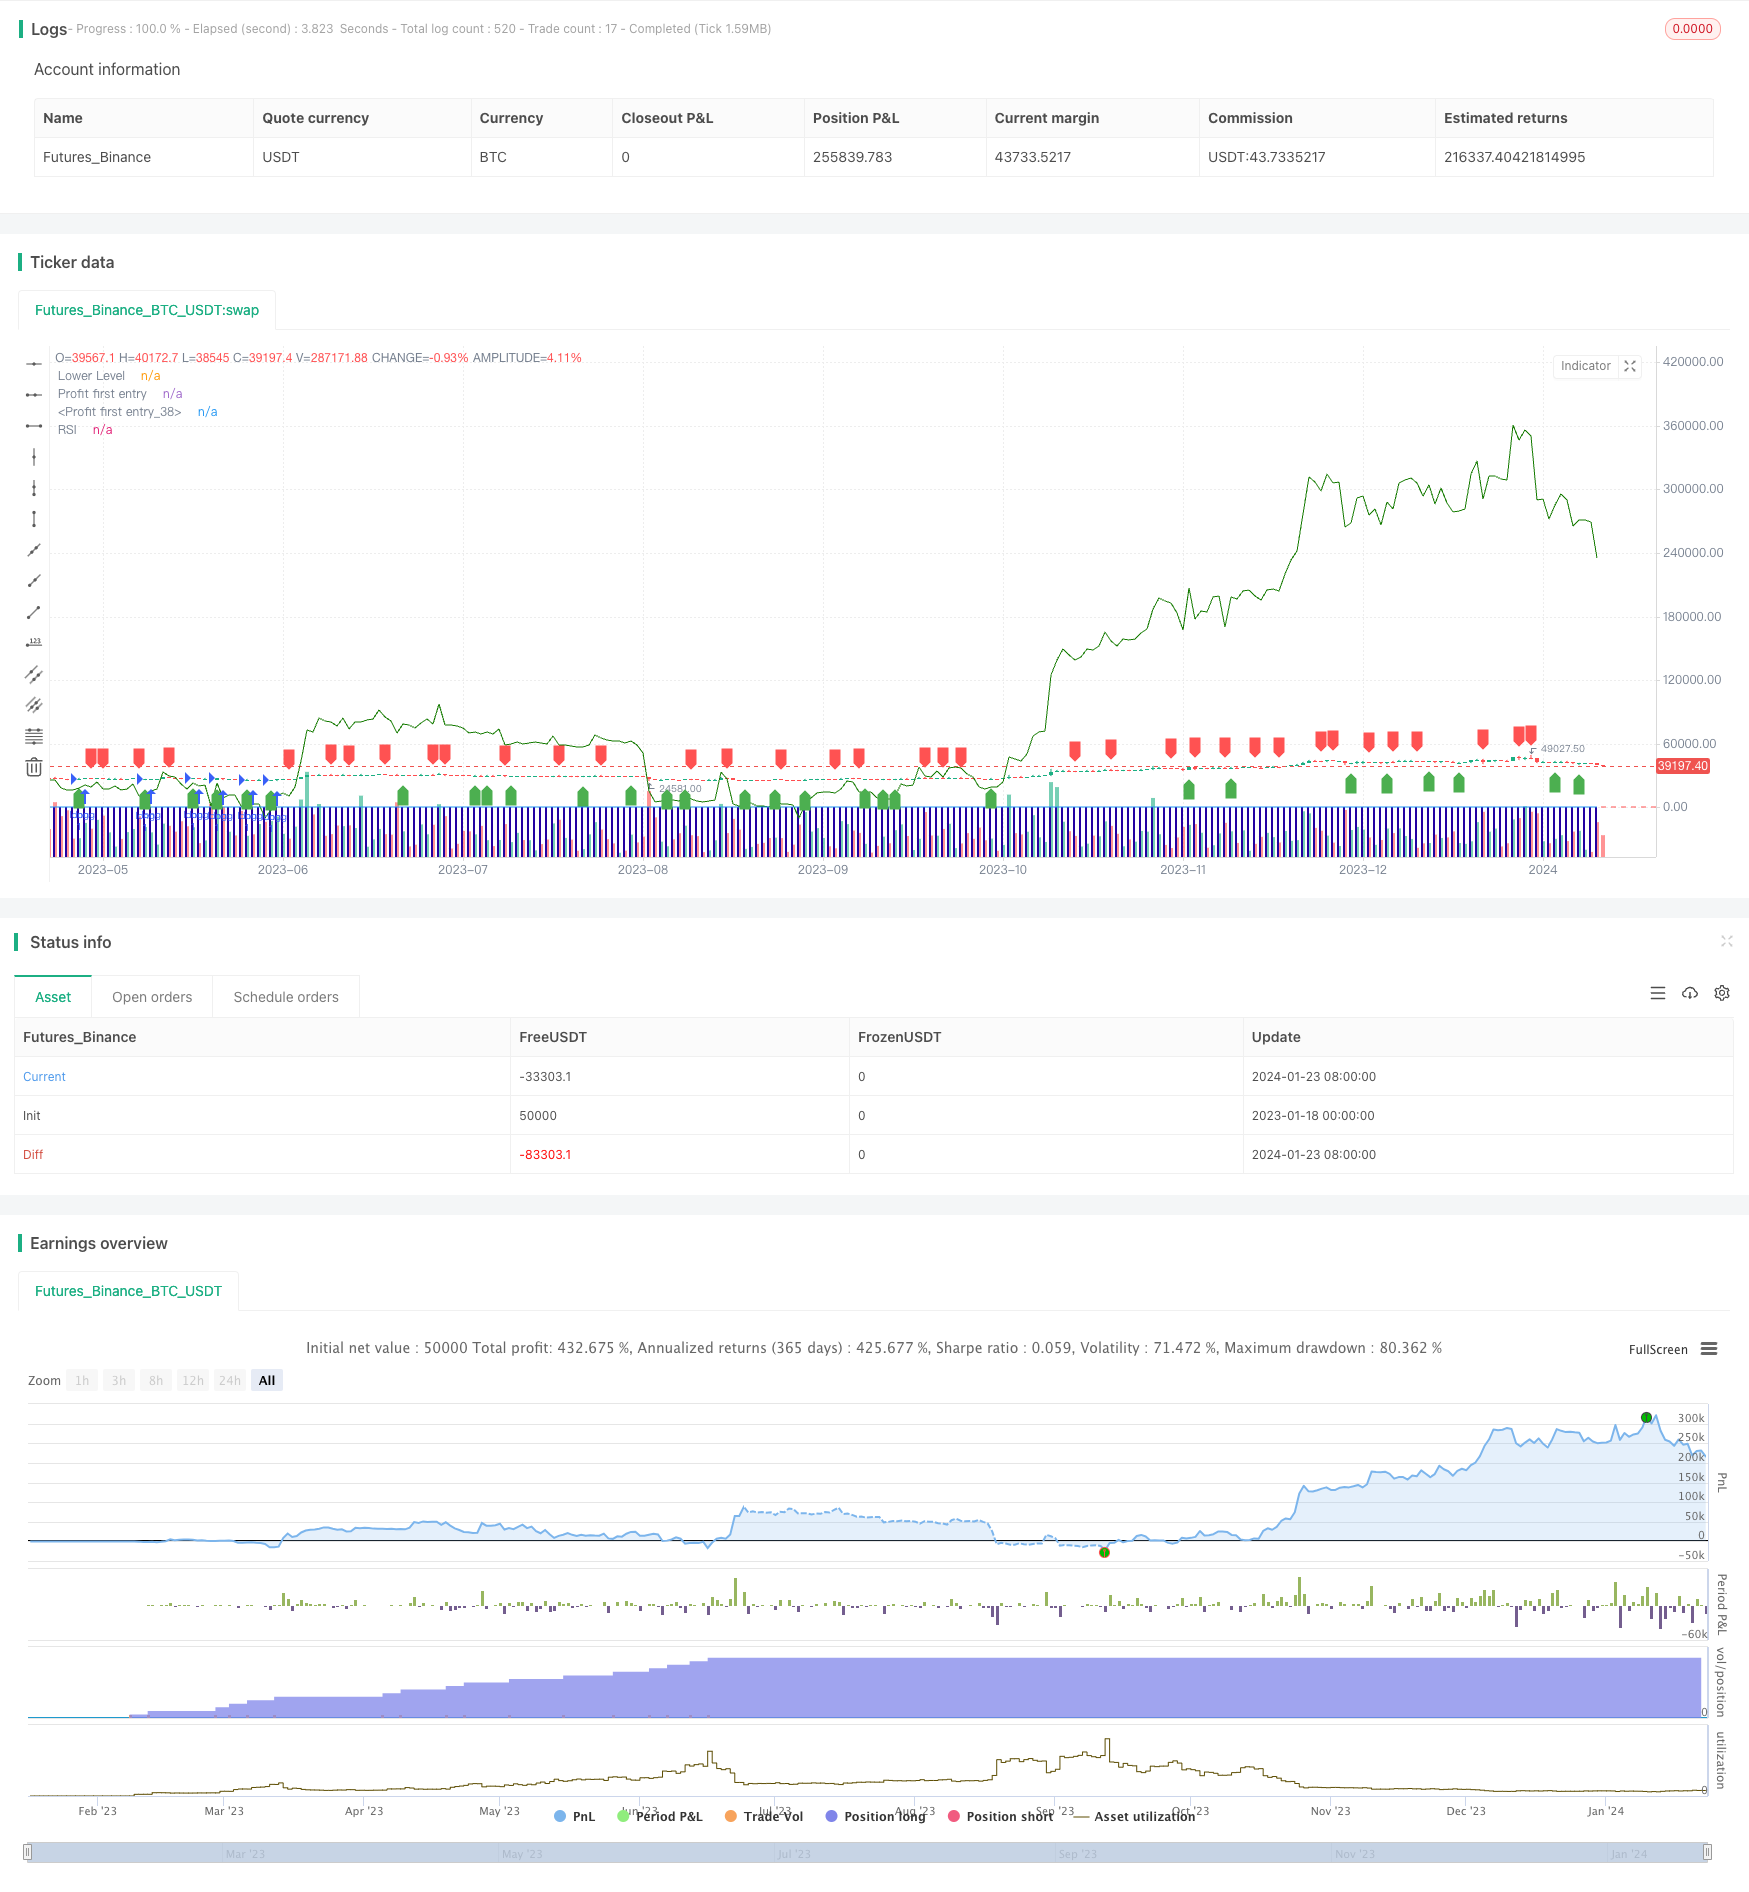
start: 2023-01-18 00:00:00
end: 2024-01-24 00:00:00
period: 1d
basePeriod: 1h
exchanges: [{"eid":"Futures_Binance","currency":"BTC_USDT"}]
*/
//@version=4
strategy("RSI Strategy", overlay=true,pyramiding = 1000)
rsi_period = 2
rsi_lower = 20
rsi_upper = 70
rsi_value = rsi(close, rsi_period)
buy_signal = crossover(rsi_value, rsi_lower)
sell_signal = crossunder(rsi_value, rsi_upper)
current_date1 = input(defval=timestamp("01 Nov 2009 00:00 +0000"), title="stary Time", group="Time Settings")
current_date = input(defval=timestamp("01 Nov 2023 00:00 +0000"), title="End Time", group="Time Settings")
investment_amount = 100000.0
start_time = input(defval=timestamp("01 Dec 2018 00:00 +0000"), title="Start Time", group="Time Settings")
end_time = input(defval=timestamp("30 Nov 2023 00:00 +0000"), title="End Time", group="Time Settings")
in_time = time >= start_time and time <= end_time
// Variable to track accumulation.
var accumulation = 0.0
out_time = time >= end_time
if (buy_signal )
strategy.entry("long",strategy.long,qty= 1)
accumulation += 1
if (out_time)
strategy.close(id="long")
plotshape(series=buy_signal, title="Buy Signal", location=location.belowbar, color=color.green, style=shape.labelup)
plotshape(series=sell_signal, title="Sell Signal", location=location.abovebar, color=color.red, style=shape.labeldown)
plot(rsi_value, title="RSI", color=color.blue)
hline(rsi_lower, title="Lower Level", color=color.red)
plot(strategy.opentrades, style=plot.style_columns,
color=#2300a1, title="Profit first entry")
plot(strategy.openprofit, style=plot.style_line,
color=#147a00, title="Profit first entry")
// plot(strategy.position_avg_price, style=plot.style_columns,
// color=#ca0303, title="Profit first entry")
// log.info(strategy.position_size * strategy.position_avg_price)