概述
本策略通过布林带、KC通道和蜡烛线颜色等多重指标判断市场的压缩和释放,并结合均线的方向判断 establishment 趋势,在趋势方向发生转折的时候进行操作。
策略原理
计算布林带。布林带中轨为N日收盘价的简单移动平均线,上轨为中轨+KC通道的N日真实波幅的M倍,下轨为中轨-KC通道的N日真实波幅的M倍。
计算KC通道。KC通道中轨为N日收盘价的简单移动平均线,上轨为中轨+N日真实波幅的M倍,下轨为中轨-N日真实波幅的M倍。
判断压缩和释放。当布林带上轨低于KC通道上轨且布林带下轨高于KC通道下轨时为压缩,当布林带上轨高于KC通道上轨且布林带下轨低于KC通道下轨时为释放。
计算establishment趋势。以N日收盘价-N日最高价和最低价的平均价为输入,计算N日线性回归,其值大于0表示establishment上涨趋势,小于0表示establishment下跌趋势。
交易信号。establishment上涨时,短阳线和释放为做多信号;establishment下跌时,短阴线和压缩为做空信号。
策略优势
多重指标判断,提高信号准确率。结合布林带、KC通道和蜡烛线判断市场走势,避免假信号。
establishment趋势判断,按趋势交易。利用establishment判断主要趋势,避免逆势操作。
自动止损,控制风险。当价格触碰止损线时,自动平仓止损。
策略风险
布林带和KC通道参数设置不当,可能导致压缩和释放判断错误。
establishment趋势判断滞后,可能错过趋势转折点。
突发事件造成巨大行情,无法止损,存在较大亏损风险。
优化方法:调整布林带和KC通道参数,采用ADX等指标辅助判断;及时更新establishment均线周期,降低滞后;设置止损线时加入缓冲区。
策略优化方向
结合更多技术指标,提高建仓信号准确性。例如KDJ、MACD等。
优化establishment均线的周期参数,使其更能捕捉新的趋势。
加入交易量指标,避免虚假突破。例如能量潮指标、Accumulation/Distribution等。
多时间周期判断,区分中长线和短线信号。避免被套。
AI优化参数, searched枚举和searched最优参数组合。降低过拟合。
总结
本策略主要思路是:采用布林带判定市场的压缩和释放;辅助使用establishment趋势判断主要趋势方向;在压缩释放的转折点进行反establishment方向的操作。策略优势是信号较准、有止损、避免假信号。策略可优化的方向有:多指标组合、趋势判断参数优化、加入量能指标、多时间周期判断、AI寻优等。总体来说,本策略基于市场的自我相似和周期性运行规律,通过指标描绘市场节奏的变化,在市场由能量存积转为能量释放的关键点进行交易,属于典型的计时交易策略。
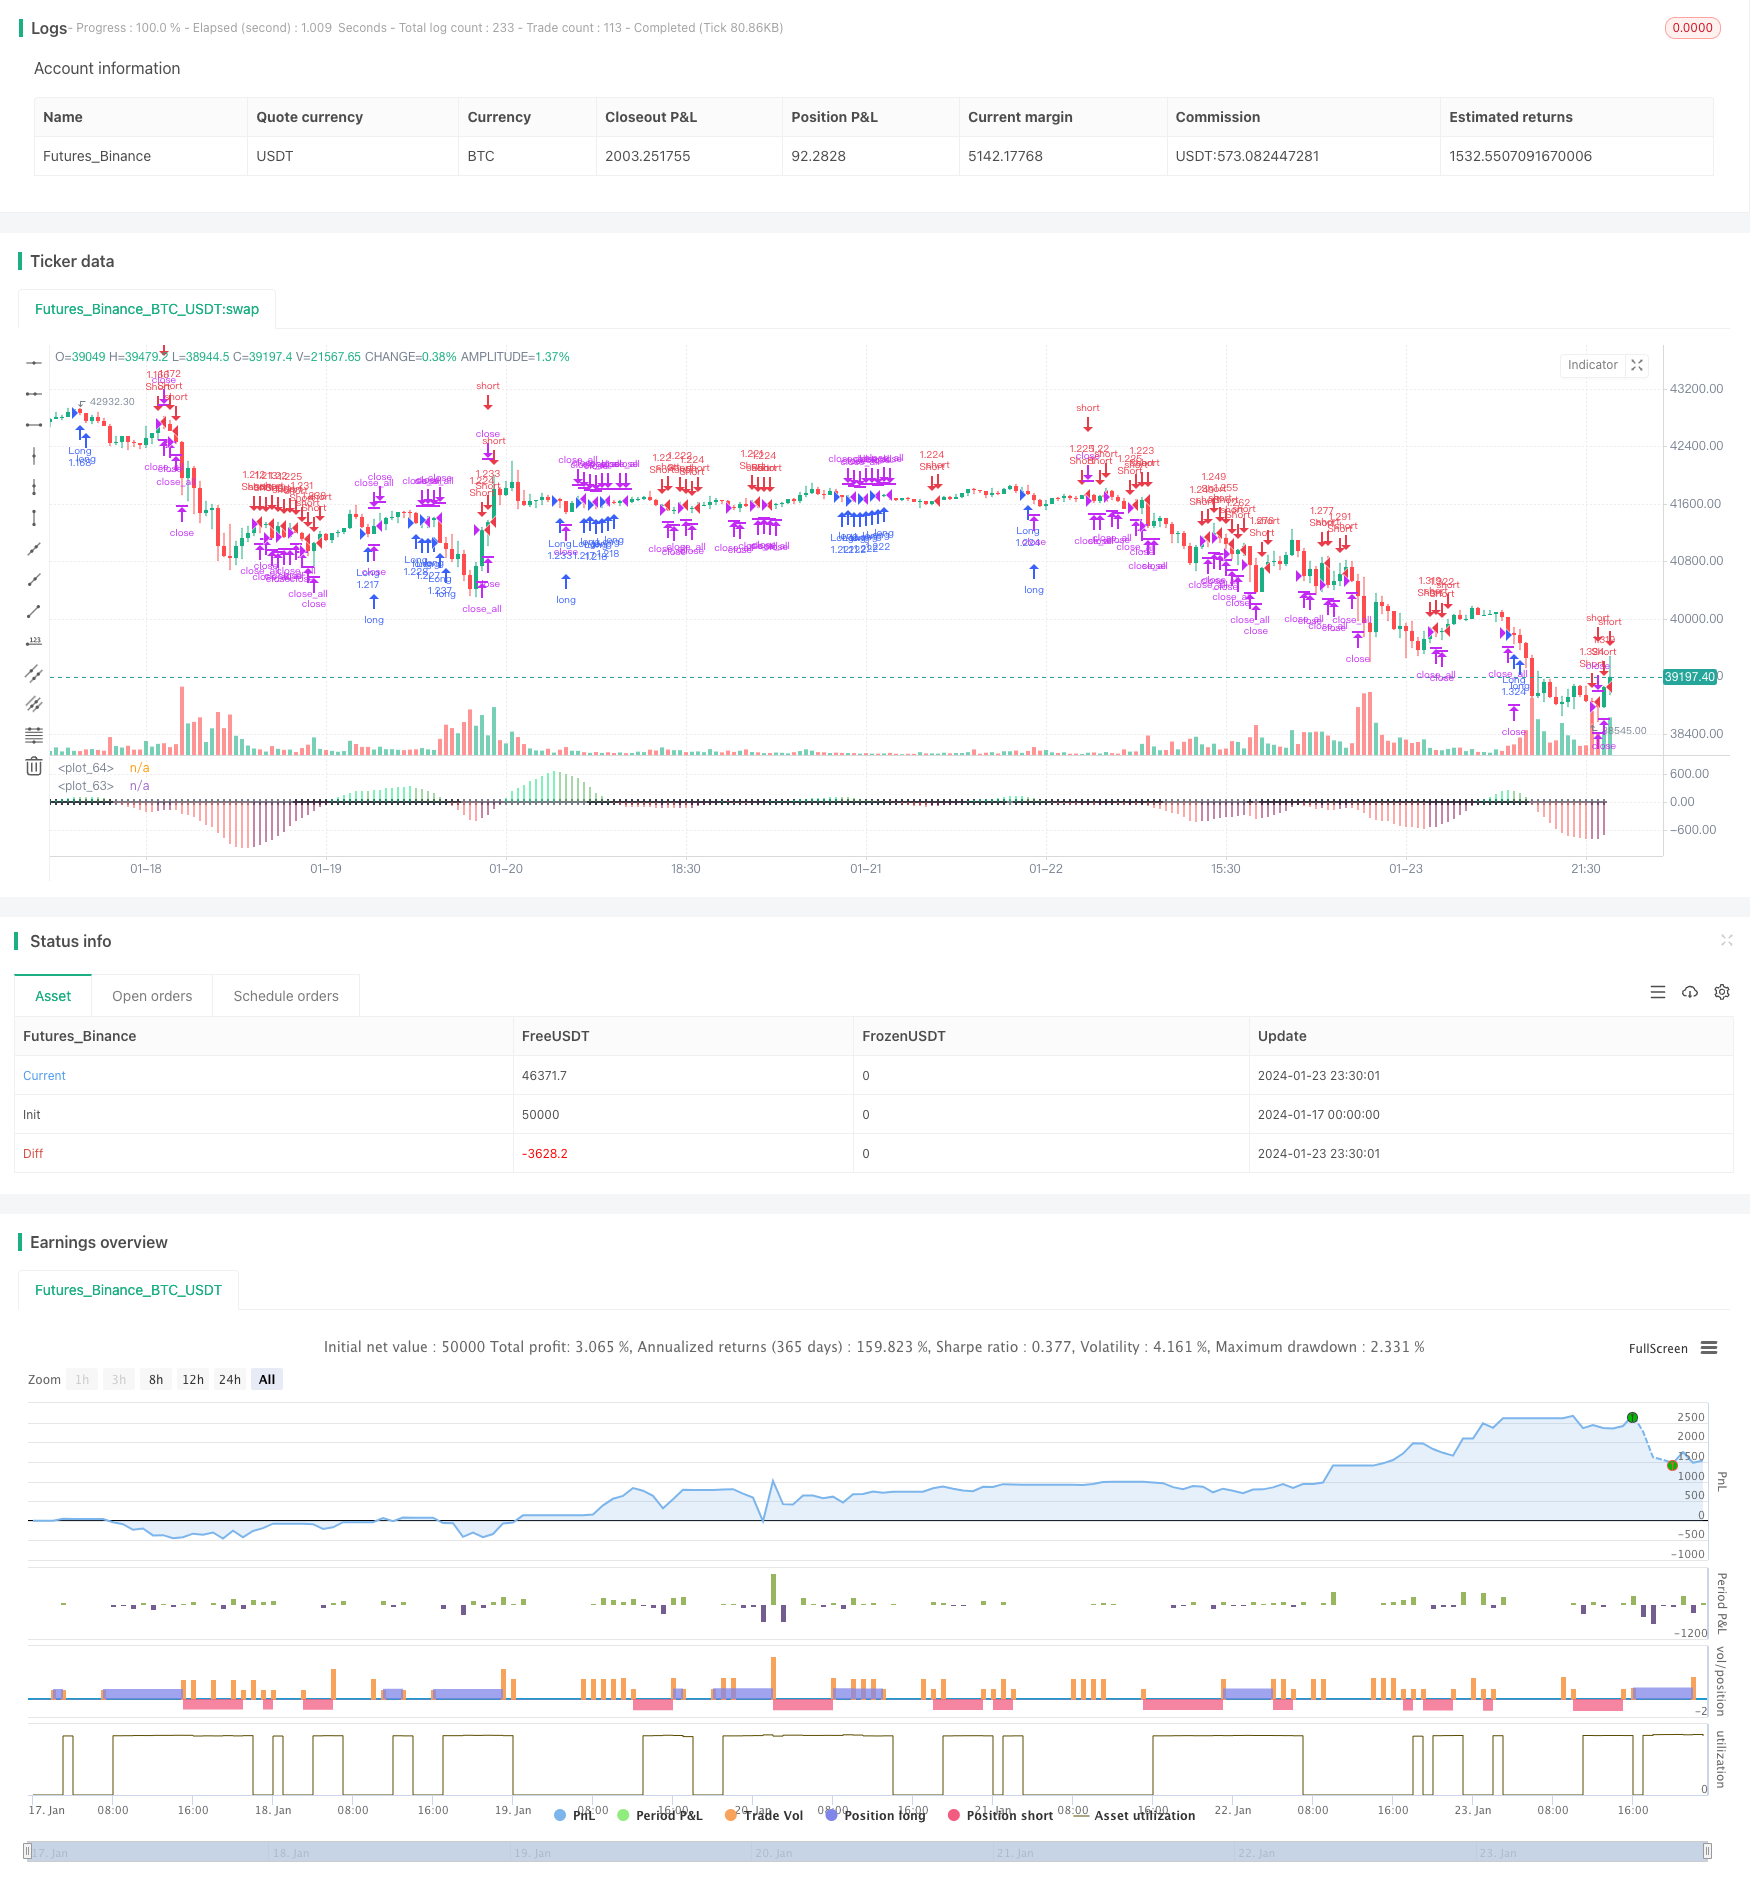
/*backtest
start: 2024-01-17 00:00:00
end: 2024-01-24 00:00:00
period: 30m
basePeriod: 15m
exchanges: [{"eid":"Futures_Binance","currency":"BTC_USDT"}]
*/

//Noro
//2017

//@version=2
strategy(shorttitle = "Squeeze str 1.1", title="Noro's Squeeze Momentum Strategy v1.1", overlay = false, default_qty_type = strategy.percent_of_equity, default_qty_value = 100, pyramiding = 0)

//Settings
needlong = input(true, defval = true, title = "Long")
needshort = input(true, defval = true, title = "Short")
lev = input(1, defval = 1, minval = 1, maxval = 100, title = "leverage")
length = input(20, title="BB Length")
mult = input(2.0,title="BB MultFactor")
lengthKC=input(20, title="KC Length")
multKC = input(1.5, title="KC MultFactor")
useTrueRange = true
mode2 = input(true, defval = true, title = "Mode 2")
usecolor = input(true, defval = true, title = "Use color of candle")
usebody = input(true, defval = true, title = "Use EMA Body")
needbg = input(false, defval = false, title = "Show trend background")
fromyear = input(2018, defval = 2018, minval = 1900, maxval = 2100, title = "From Year")
toyear = input(2100, defval = 2100, minval = 1900, maxval = 2100, title = "To Year")
frommonth = input(01, defval = 01, minval = 01, maxval = 12, title = "From Month")
tomonth = input(12, defval = 12, minval = 01, maxval = 12, title = "To Month")
fromday = input(01, defval = 01, minval = 01, maxval = 31, title = "From day")
today = input(31, defval = 31, minval = 01, maxval = 31, title = "To day")

// Calculate BB
source = close
basis = sma(source, length)
dev = multKC * stdev(source, length)
upperBB = basis + dev
lowerBB = basis - dev

// Calculate KC
ma = sma(source, lengthKC)
range = useTrueRange ? tr : (high - low)
rangema = sma(range, lengthKC)
upperKC = ma + rangema * multKC
lowerKC = ma - rangema * multKC

sqzOn  = (lowerBB > lowerKC) and (upperBB < upperKC)
sqzOff = (lowerBB < lowerKC) and (upperBB > upperKC)
noSqz  = (sqzOn == false) and (sqzOff == false)

val = linreg(source  -  avg(avg(highest(high, lengthKC), lowest(low, lengthKC)),sma(close,lengthKC)), lengthKC,0)

bcolor = iff( val > 0, iff( val > nz(val[1]), lime, green), iff( val < nz(val[1]), red, maroon))
scolor = noSqz ? blue : sqzOn ? black : gray

trend = val > 0 ? 1 : val < 0 ? -1 : 0

//Background
col = needbg == false ? na : trend == 1 ? lime : red
bgcolor(col, transp = 80)

//Body
body = abs(close - open)
abody = sma(body, 10) / 3

//Indicator
bcol = iff( val > 0, iff( val > nz(val[1]), lime, green), iff( val < nz(val[1]), red, maroon))
scol = noSqz ? blue : sqzOn ? black : gray
plot(val, color=bcol, style=histogram, linewidth=4)
plot(0, color=scol, style=cross, linewidth=2)

//Signals
bar = close > open ? 1 : close < open ? -1 : 0
up1 = trend == 1 and (bar == -1 or usecolor == false) and (body > abody or usebody == false) and mode2 == false
dn1 = trend == -1 and (bar == 1 or usecolor == false) and (body > abody or usebody == false) and mode2 == false

up2 = trend == 1 and val < val[1] and mode2
dn2 = trend == -1 and val > val[1] and mode2

exit = (strategy.position_size > 0 and close > strategy.position_avg_price) or (strategy.position_size < 0 and close < strategy.position_avg_price) and mode2

//Trading
lot = strategy.position_size == 0 ? strategy.equity / close * lev : lot[1]

if up1 or up2
    strategy.entry("Long", strategy.long, needlong == false ? 0 : lot)

if dn1 or dn2
    strategy.entry("Short", strategy.short, needshort == false ? 0 : lot)

if exit
    strategy.close_all()