概述
本策略的核心是利用卡尔曼滤波技术对价格均线进行平滑处理,通过计算平滑后的均线的切线角,当切线角在指定周期内超过一定阈值时产生交易信号。该策略致力于跟踪中长线趋势,通过卡尔曼滤波技术减少噪音的影响,从而获得更加清晰和可靠的趋势信号。
策略原理
本策略的核心逻辑主要包含以下几个步骤:
计算1分钟价格的简单移动平均线(SMA)作为原始均线;
对原始均线进行卡尔曼滤波,输出平滑后的均线;
计算平滑后的均线的切线角;
定义参数周期,统计周期内切线角的总和;
当周期内切线角总和大于360度时产生买入信号;当小于-360度时产生卖出信号。
通过这样的设计,当价格出现向上或向下的趋势时,均线的切线角会逐步积累,当积累到一定程度时产生交易信号,因而能够有效跟踪中长线趋势。
其中,卡尔曼滤波是本策略的关键所在。卡尔曼滤波是一种递归算法,它在预测当前状态的同时,也会预测过程噪声和测量噪声的值,并利用这些噪声的值来校正当前状态的预测,从而获得更加准确和可靠的状态估计。
在本策略中,价格的SMA可以看作是状态的测量,受到市场噪音的影响,卡尔曼滤波器会递归地估计价格的真实趋势,大幅减少噪声的影响,使得后续的均线运算更加可靠,从而产生更稳定和准确的交易信号。
策略优势
相比简单移动平均线等指标策略,本策略最大的优势在于利用卡尔曼滤波减少了噪声的影响,使得交易信号更加清晰可靠。具体优势主要体现在以下几个方面:
减少假信号。卡尔曼滤波通过自适应地估计和消除噪声,有效过滤掉了大量由随机波动引发的假信号,使得产生的交易信号更加可靠。
更佳跟踪效果。平滑后的均线形态更加流畅,能够更好地反映价格中长线趋势,从而实现更出色的趋势跟踪效果。
可调参数设置灵活。可调整的参数包括均线长度、卡尔曼滤波的参数和统计周期,能够灵活适应不同市场环境。
风险可控。本策略更多关注中长线趋势而不是短期波动,实现了较好的风险回报平衡。
实现简单,容易扩展。本策略的核心算法较为简洁,易于实现和测试,也提供了扩展的空间,如可引入机器学习算法自动优化参数等。
策略风险
本策略也存在以下主要风险:
趋势反转风险。本策略侧重趋势跟踪,一旦发生剧烈的趋势反转则会产生较大损失。可通过适当缩短统计周期以减少单笔损失。
参数优化风险。不当的参数设置可能导致交易频繁或信号滞后,需要充分测试优化。可结合机器学习算法自动优化。
过优化风险。在历史数据上过度优化也可能导致参数失效,需要控制在样本外有效。
实现复杂度增加风险。引入卡尔曼滤波和切线角算法会增加代码复杂度,需要确保正确实现。
策略优化方向
考虑到上述风险因素,本策略可优化的方向包括:
引入止损和仓位管理。适当的止损可以有效控制单笔损失风险;动态仓位管理也可以根据市场情况调整仓位覆盖风险。
自动参数优化。通过机器学习优化算法,可以实现参数的自动优化,避免过优化风险。
集成其他指标。可以在策略中集成一些其他指标,形成指标组合,以提升策略稳定性。
增加效率评估。引入更多风险调整指标,对策略效率和稳定性进行评估,从而得出更全面准确的结论。
扩展多个品种。如果效果良好,可以考虑扩展到更多品种,从中长期积累更丰富的样本,也方便跨品种参数优化。
总结
本策略总体来说是一个较为简单实用的趋势跟踪策略。相比传统移动平均线策略,引入卡尔曼滤波算法是其最大的创新点,也使得策略能够产生更加清晰和可靠的交易信号。下一步通过进一步优化,本策略可望取得更加优异的效果。总的来说,本策略为量化交易策略提供了一种新的思路,值得进一步研究和应用。
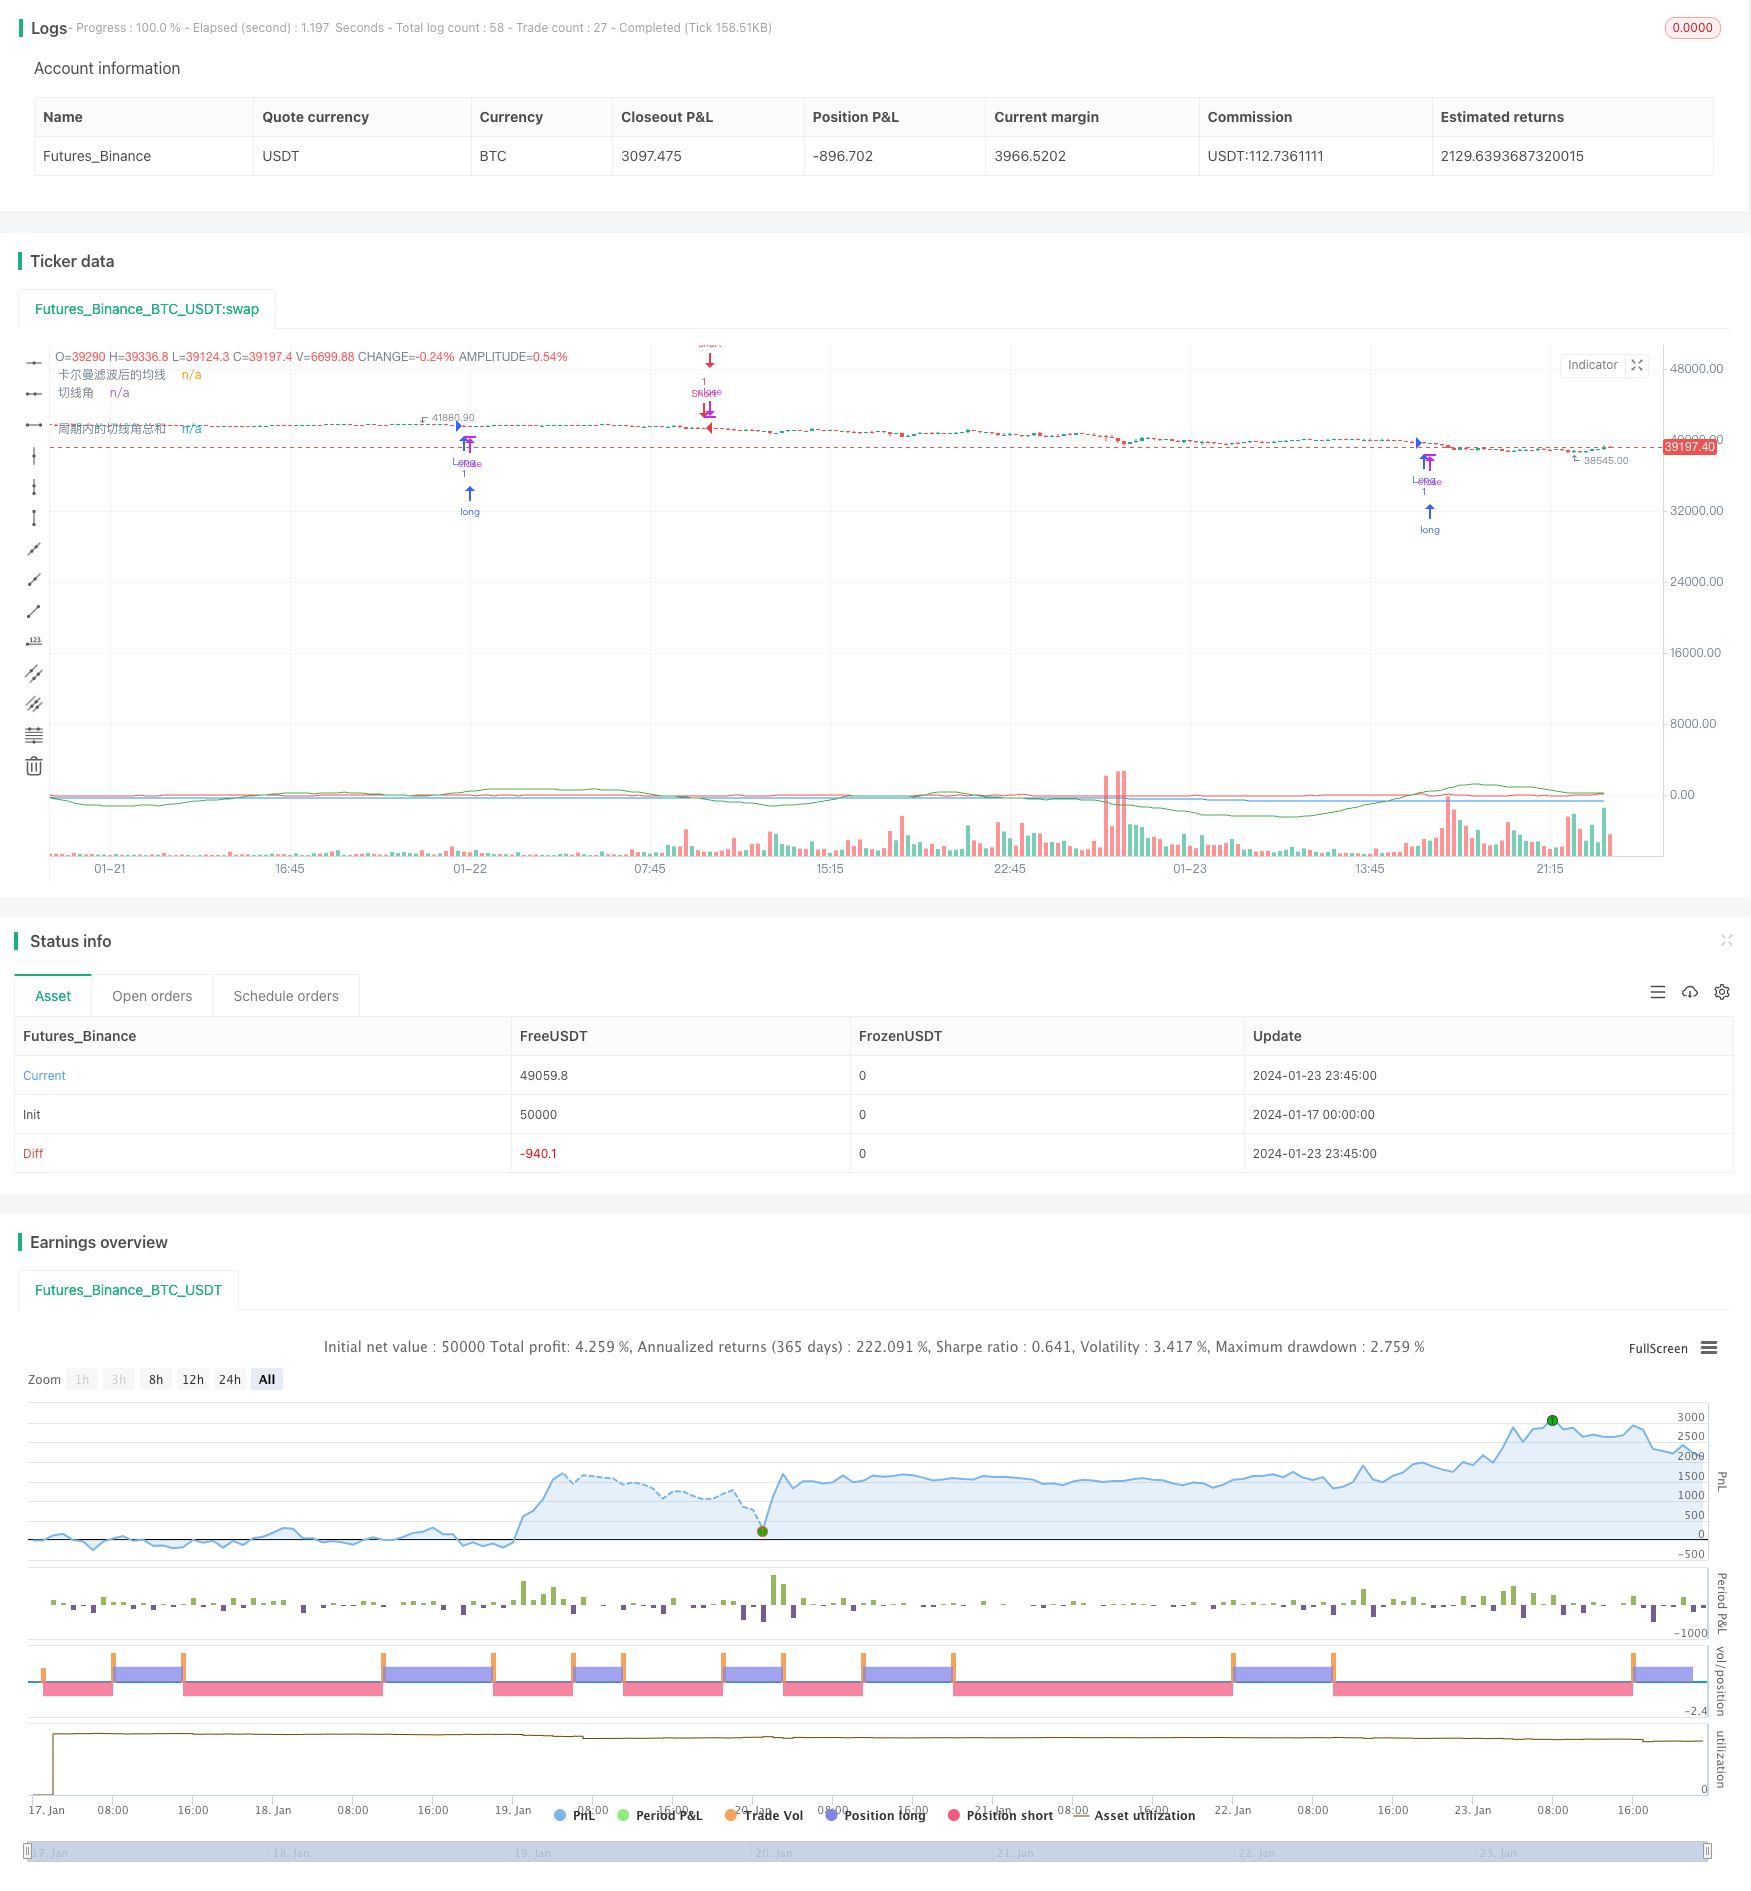
/*backtest
start: 2024-01-17 00:00:00
end: 2024-01-24 00:00:00
period: 15m
basePeriod: 5m
exchanges: [{"eid":"Futures_Binance","currency":"BTC_USDT"}]
*/

//@version=5
//@library=math
strategy("策略360°(测试)", overlay=true)

// 定义1分钟均线
ma1 = request.security(syminfo.tickerid, "1", ta.sma(close, 1)) // 在这里使用了 math.sma() 函数
//plot(ma1, color=color.yellow, title="原始均线")

// 定义卡尔曼滤波函数,参考了[1](https://www.tradingview.com/pine-script-docs/en/v5/language/Methods.html)和[2](https://www.tradingview.com/pine-script-docs/en/v5/language/Operators.html)的代码
kalman(x, g) =>
    kf = 0.0
    dk = x - nz(kf[1], x) // 在这里使用了 nz() 函数
    smooth = nz(kf[1], x) + dk * math.sqrt(g * 2) // 在这里使用了 math.sqrt() 函数
    velo = 0.0
    velo := nz(velo[1], 0) + g * dk // 在这里使用了 nz() 函数
    kf := smooth + velo
    kf

// 定义卡尔曼滤波后的均线
ma2 = kalman(ma1, 0.01)
plot(ma2, color=color.blue, title="卡尔曼滤波后的均线")

// 定义切线角
angle = math.todegrees(math.atan(ma2 - ma2[1])) // 在这里使用了 math.degrees() 和 math.atan() 函数

// 定义累加的切线角
cum_angle = 0.0
cum_angle := nz(cum_angle[1], 0) + angle // 在这里使用了 nz() 函数

// 定义30分钟周期
period = 30 // 您可以根据您的需要修改这个参数

// 定义周期内的切线角总和
sum_angle = 0.0
sum_angle := math.sum(angle, period) // 在这里使用了 math.sum() 函数,把周期内的切线角总和改成简单地把 5 个切线角相加

// 定义买入和卖出条件
buy = sum_angle > 360// 在这里使用了 math.radians() 函数
sell = sum_angle < -360

// 执行买入和卖出操作
strategy.entry("Long", strategy.long, when=buy)
strategy.close("Short", when=buy)
strategy.entry("Short", strategy.short, when=sell)
strategy.close("Long", when=sell)

// 绘制曲线图
plot(sum_angle, color=color.green, title="周期内的切线角总和")
plot(angle, color=color.red, title="切线角") // 这是我为您添加的代码,用于显示实时计算的切线角