Momentum Oscillator & 123 Pattern Strategy

Overview
This strategy combines the Momentum Oscillator Index and 123 Pattern into a cumulative trading signal to improve profitability. The Momentum Oscillator tracks market volatility and adjusts RSI parameters to capture short-term trends. The 123 Pattern forms trade signals by identifying minor highs and lows of prices in the short run. The combination of both strategies allows the strategy to maintain performance across different market environments.
Strategy Logic
123 Pattern
The 123 Pattern consists of three stages. First, the price declines for two consecutive days. Second, the price rises for the next two days. Finally, the price declines again on the third day. According to this pattern, we can determine to establish a long position when prices rise in the second stage, and a short position when prices fall back in the third stage.
Specifically, if the closing price is higher than the previous close for two consecutive days after two days of decline, and the 9-day Stochastic Slow is below 50, it is a buy signal. If the closing price is lower than the previous close for two consecutive days after two days of increase, and the 9-day Stochastic Fast is above 50, it is a sell signal.
Momentum Oscillator
The Momentum Oscillator is constructed similarly to the RSI, with the key difference being the variable periods of the momentum oscillator. The number of periods depends on recent price volatility - higher volatility leads to shorter periods, making the indicator more sensitive, while stable prices lead to longer periods to reduce false signals.
The calculation formula is:
DMI = RSI(DTime)
Where:
DTime = 14 / 10-day SMA of standard deviation of close over past 5 days
It shares the same overbought/oversold thresholds as RSI:
Overbought: DMI > 30
Oversold: DMI < 70
Buy and sell signals are generated when the DMI crosses these thresholds.
Advantage Analysis
-
The 123 Pattern is simple and effective. It utilizes short-term reversal patterns to enter on minor bottoms and exit on minor tops, avoiding taking positions against the trend.
-
The Momentum Oscillator is more sensitive. Its variable period allows it to adapt to the market and timely capture turning points even during high volatility.
-
Both strategies help filter out false signals effectively. Checking the DMI for market context when 123 signals occur can reduce losses from trading against the trend.
-
Combines the strengths of both strategies. Using DMI as a filter along with the 123 Pattern greatly enhances the stability of the system.
Risk Analysis
-
Prone to signal whipsaws. Both DMI and 123 Pattern can generate false signals when prices are just temporarily fluctuating rather than reversing.
-
Potentially high trading frequency. DMI's variable periods make it extremely sensitive to market noise. Parameters need proper tuning to control trade frequency.
-
123 Pattern may miss mid-term trend opportunities. It mainly captures short-term reversals and cannot profit consistently from mid-long term trends.
-
Need to limit max trades. Too many trades can result in heavy commission fees and slippage costs.
Optimization Directions
-
Optimize DMI parameters. Can test different RSI periods, threshold values to find best combination.
-
Optimize 123 Pattern filters. Can test different Stoch parameters or other filters like MACD.
-
Add stop loss mechanisms. Appropriate stop loss sizes help limit downside on losing trades.
-
Add position sizing rules. Fixed quantity or fixed fractional position sizing improves risk control.
Conclusion
This strategy combines analysis from both the Momentum Oscillator and 123 Pattern to improve trade signal performance. However, no single strategy can perfectly adapt to shifting market conditions. Investors should focus on controlling risks, constantly backtest and update parameters based on live results so that profitability can be sustained.
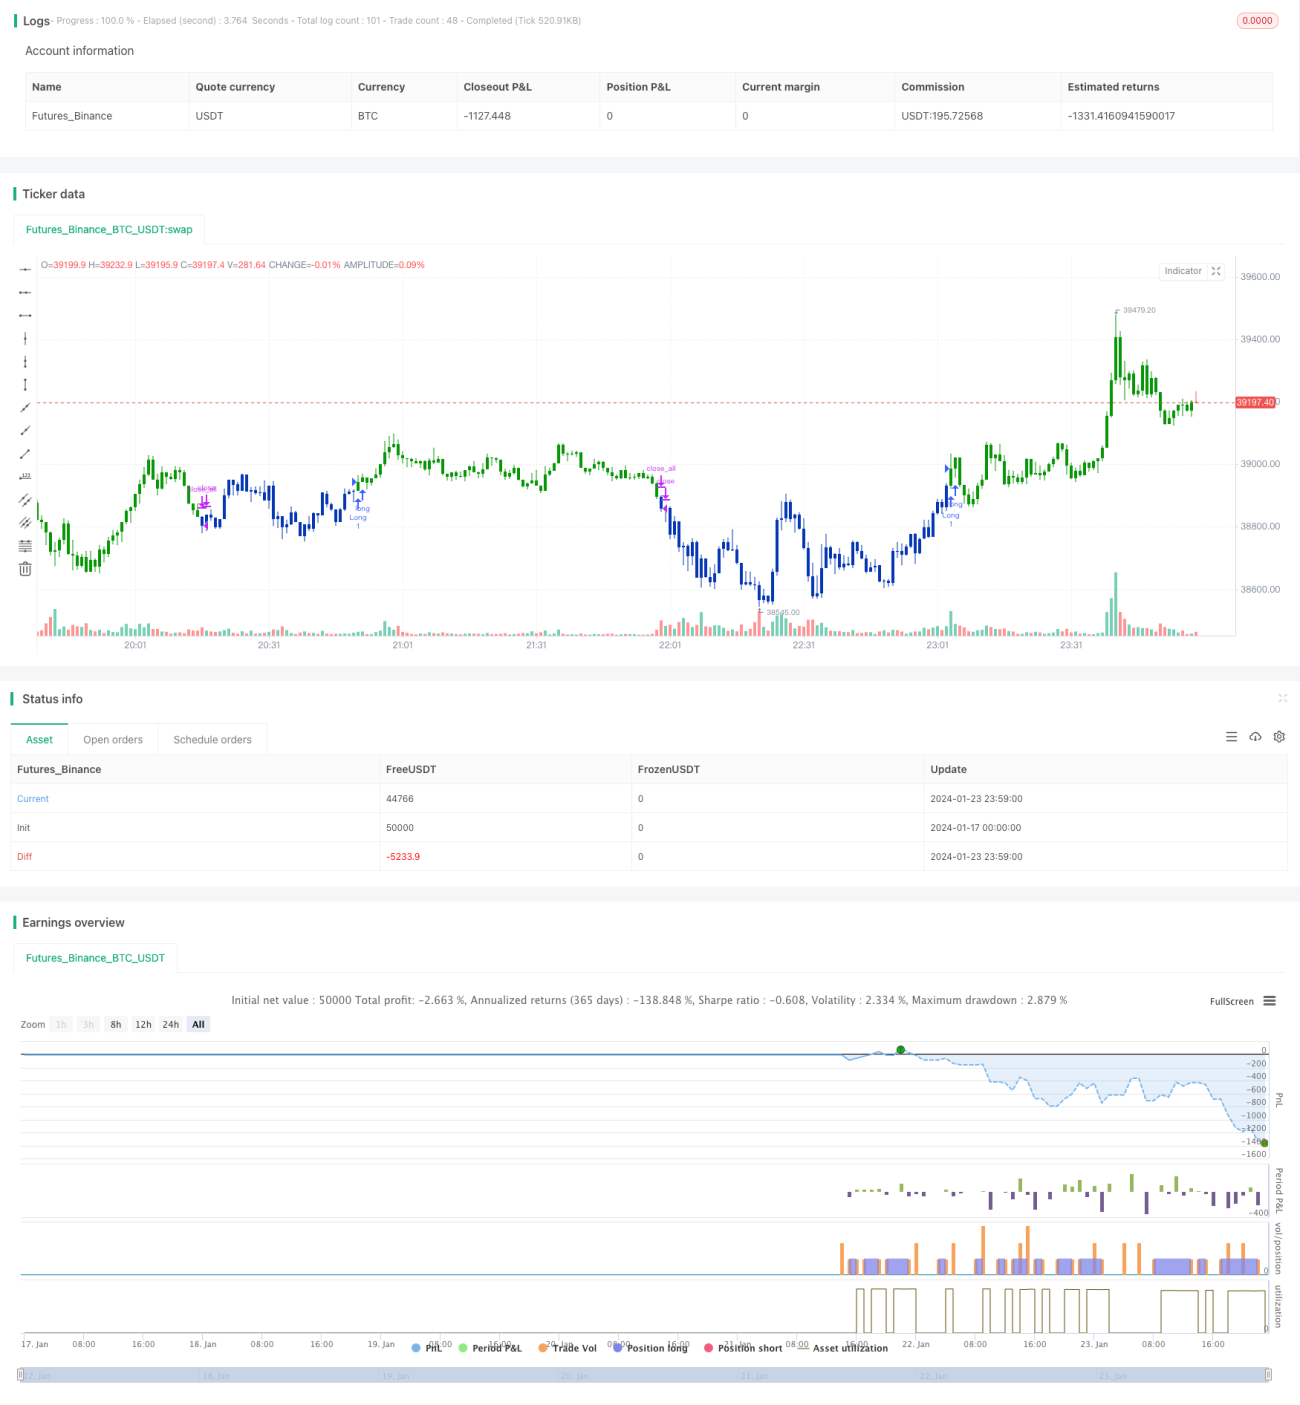
/*backtest
start: 2024-01-17 00:00:00
end: 2024-01-24 00:00:00
period: 1m
basePeriod: 1m
exchanges: [{"eid":"Futures_Binance","currency":"BTC_USDT"}]
*/

//@version=4
////////////////////////////////////////////////////////////
//  Copyright by HPotter v1.0 18/03/2020
// This is combo strategies for get a cumulative signal. - 1