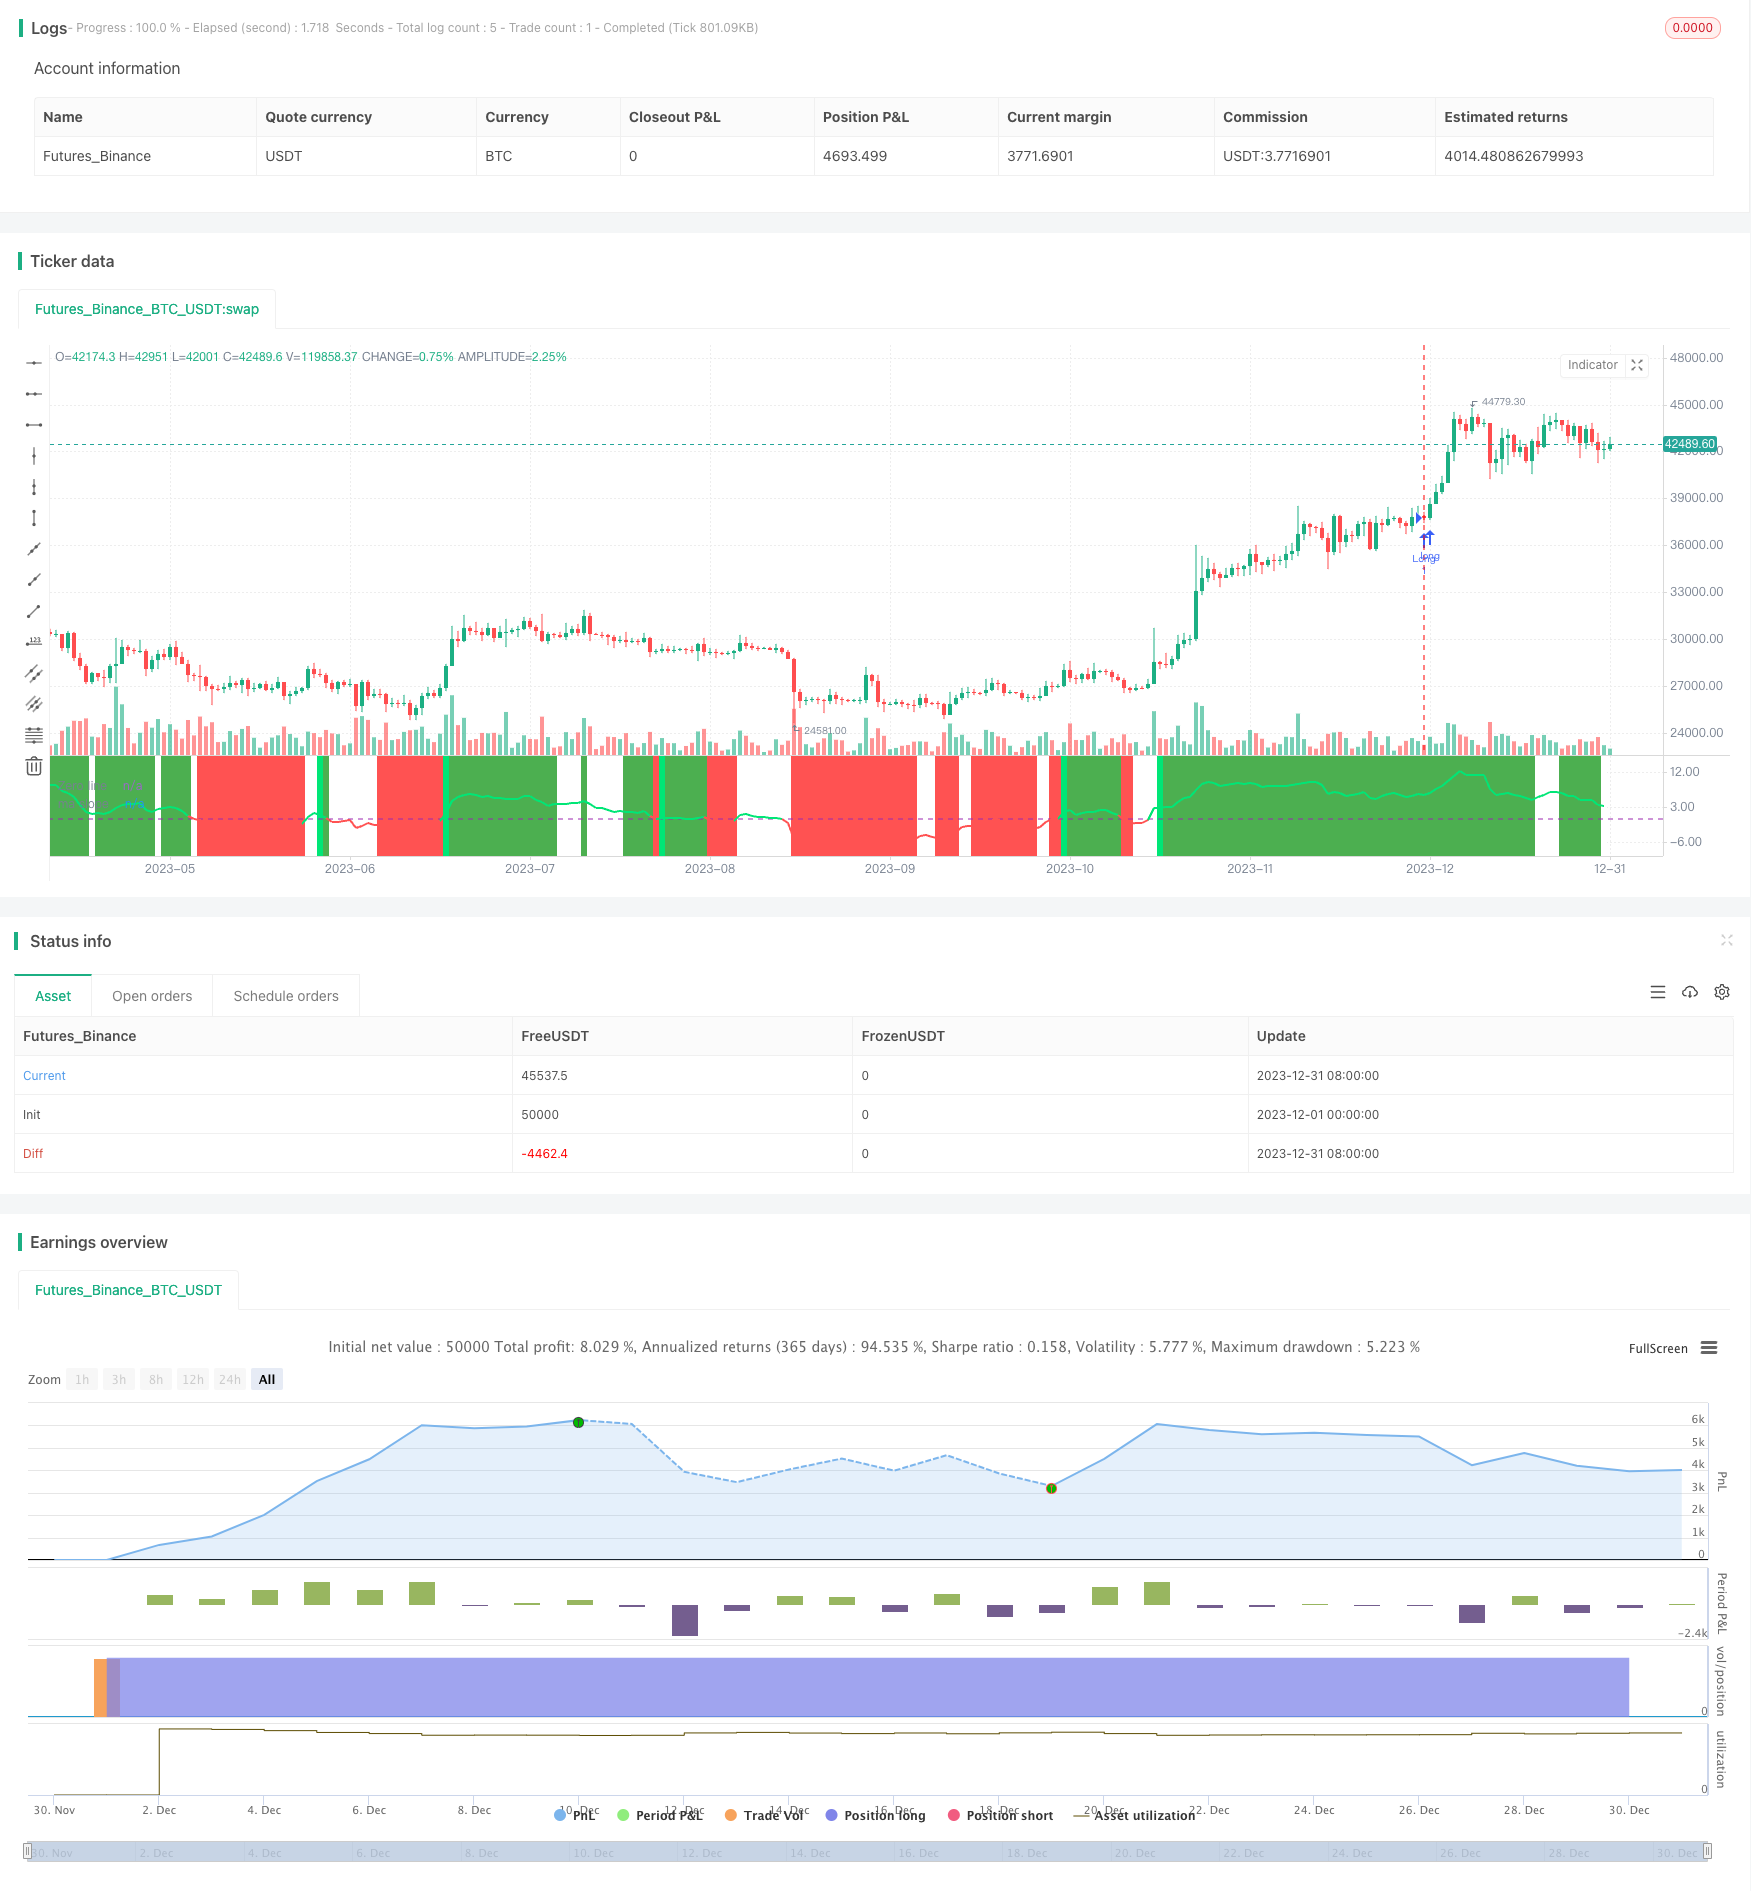
概述
该策略通过计算均线的斜率角度,判断趋势方向,结合价格变化率指标,进行长短双向交易。其本质是利用均线斜率角度判定价格趋势,以及价格变化率指标过滤盘整行情的趋势跟踪策略。
策略原理
该策略主要基于以下指标进行判断:
均线角度:通过计算Jurik均线和指数移动平均线的斜率角度,来判断价格趋势方向。角度大于0为上涨趋势,小于0为下跌趋势。
价格变化率:计算最近12根K线的收盘价变化率,通过波动性来过滤无效信号。
当均线角度向上(大于0)且价格变化率满足条件时,做多;当均线角度向下(小于0)且价格变化率满足条件时,做空。
具体来说,策略首先计算出Jurik均线和EMA的斜率角度。然后计算出价格的变化率指标,用于过滤盘整时期。当均线角度指示趋势,且价格变化率符合条件时,产生交易信号。
优势分析
该策略具有以下优势:
利用均线斜率判断趋势非常可靠,胜率较高。
价格变化率指标可有效过滤盘整波动,避免无效交易。
Jurik均线对突破做出迅速反应,EMA则提供稳定的趋势判断,两者互补。
采用长短双向交易方式,可在趋势行情中捕捉较大利润。
风险分析
该策略也存在一些风险:
价格剧烈震荡时,均线产生错误信号的概率较大。可通过优化参数降低此风险。
进入盘整时均线信号可能频繁切换,产生过多不必要交易。可加入附加过滤条件以减少无效交易。
突发事件造成价格跳空时,止损可能被击穿,可适当放宽止损点。
优化方向
该策略可从以下几个方面进行优化:
优化均线参数,寻找最佳参数组合,提高策略稳定性。
增加波动率、交易量等过滤条件,进一步减少无效交易。
结合其他指标判断止损点,使止损更加智能化。
开发自适应交易大小算法,让盈利更加平稳。
总结
该策略整体来说是非常实用的趋势跟踪策略。它利用均线斜率判断趋势非常可靠,而价格变化率指标可有效过滤无效信号。同时采用长短双向交易方式可获得较好收益。通过持续优化,该策略可以成为非常稳定可靠的量化策略。
/*backtest
start: 2023-12-01 00:00:00
end: 2023-12-31 23:59:59
period: 1d
basePeriod: 1h
exchanges: [{"eid":"Futures_Binance","currency":"BTC_USDT"}]
*/

//@version=4
// Based on ma angles code by Duyck which also uses Everget Jurik MA calulation and angle calculation by KyJ
strategy("Trend Angle BF", overlay=false)

/////////////// Time Frame ///////////////
testStartYear = input(2017, "Backtest Start Year")
testStartMonth = input(1, "Backtest Start Month")
testStartDay = input(1, "Backtest Start Day")
testPeriodStart = timestamp(testStartYear,testStartMonth,testStartDay, 0, 0)

testStopYear = input(2019, "Backtest Stop Year")
testStopMonth = input(12, "Backtest Stop Month")
testStopDay = input(31, "Backtest Stop Day")
testPeriodStop = timestamp(testStopYear,testStopMonth,testStopDay, 0, 0)

testPeriod() => true

src=input(ohlc4,title="source")

// definition of "Jurik Moving Average", by Everget
jma(_src,_length,_phase,_power) =>
    phaseRatio = _phase < -100 ? 0.5 : _phase > 100 ? 2.5 : _phase / 100 + 1.5
    beta = 0.45 * (_length - 1) / (0.45 * (_length - 1) + 2)
    alpha = pow(beta, _power)
    jma = 0.0
    e0 = 0.0
    e0 := (1 - alpha) * _src + alpha * nz(e0[1])
    e1 = 0.0
    e1 := (_src - e0) * (1 - beta) + beta * nz(e1[1])
    e2 = 0.0
    e2 := (e0 + phaseRatio * e1 - nz(jma[1])) * pow(1 - alpha, 2) + pow(alpha, 2) * nz(e2[1])
    jma := e2 + nz(jma[1])

//// //// Determine Angle by KyJ //// ////
angle(_src) =>
    rad2degree=180/3.14159265359  //pi
    ang=rad2degree*atan((_src[0] - _src[1])/atr(14))

jma_line=jma(src,10,50,1)
ma=ema(src,input(56))
jma_slope=angle(jma_line)
ma_slope=angle(ma)

///////////// Rate Of Change /////////////
source = close
roclength = input(12, minval=1)
pcntChange = input(2, minval=1)
roc = 100 * (source - source[roclength]) / source[roclength]
emaroc = ema(roc, roclength / 2)
isMoving() => emaroc > (pcntChange / 2) or emaroc < (0 - (pcntChange / 2))

/////////////// Strategy ///////////////
long = ma_slope>=0 and isMoving()
short = ma_slope<=0 and isMoving()

last_long = 0.0
last_short = 0.0
last_long := long ? time : nz(last_long[1])
last_short := short ? time : nz(last_short[1])

long_signal = crossover(last_long, last_short)
short_signal = crossover(last_short, last_long)

last_open_long_signal = 0.0
last_open_short_signal = 0.0
last_open_long_signal := long_signal ? open : nz(last_open_long_signal[1])
last_open_short_signal := short_signal ? open : nz(last_open_short_signal[1])

last_long_signal = 0.0
last_short_signal = 0.0
last_long_signal := long_signal ? time : nz(last_long_signal[1])
last_short_signal := short_signal ? time : nz(last_short_signal[1])

in_long_signal = last_long_signal > last_short_signal
in_short_signal = last_short_signal > last_long_signal

last_high = 0.0
last_low = 0.0
last_high := not in_long_signal ? na : in_long_signal and (na(last_high[1]) or high > nz(last_high[1])) ? high : nz(last_high[1])
last_low := not in_short_signal ? na : in_short_signal and (na(last_low[1]) or low < nz(last_low[1])) ? low : nz(last_low[1])
sl_inp = input(2.0, title='Stop Loss %') / 100
tp_inp = input(900.0, title='Take Profit %') / 100

take_level_l = strategy.position_avg_price * (1 + tp_inp)
take_level_s = strategy.position_avg_price * (1 - tp_inp)

since_longEntry = barssince(last_open_long_signal != last_open_long_signal[1])
since_shortEntry = barssince(last_open_short_signal != last_open_short_signal[1])

slLong = in_long_signal ? strategy.position_avg_price * (1 - sl_inp) : na
slShort = strategy.position_avg_price * (1 + sl_inp)
long_sl = in_long_signal ? slLong : na
short_sl = in_short_signal ? slShort : na

/////////////// Execution ///////////////
if testPeriod()
    strategy.entry("Long",  strategy.long, when=long)
    strategy.entry("Short", strategy.short, when=short)
    strategy.exit("Long Ex", "Long", stop=long_sl, limit=take_level_l, when=since_longEntry > 0)
    strategy.exit("Short Ex", "Short", stop=short_sl, limit=take_level_s, when=since_shortEntry > 0)

///////////// Plotting /////////////
hline(0, title='Zero line', color=color.purple, linewidth=1)
plot(ma_slope,title="ma slope", linewidth=2,color=ma_slope>=0?color.lime:color.red)
bgcolor(isMoving() ? long ? color.green : short ? color.red : na : color.white, transp=80)
bgcolor(long_signal ? color.lime : short_signal ? color.red : na, transp=30)