概述
多时间轴协同交易策略(MT-Coordination Trading Strategy)是一个高级的量化交易策略。它整合了多种技术指标,能够识别市场的短期交易机会。该策略由知名交易员I3ig_Trades设计,专门用于金融市场的高频交易。
策略原理
该策略融合了三个不同周期的平滑移动平均线(21日线、50日线和200日线)、相对强弱指数(14日RSI)和威廉指标(2日)。具体交易逻辑如下:
多头入场信号:当收盘价高于所有三条均线,RSI高于50,且当前K线的最高价高于上一根K线的向上三角形。此时开多仓。
空头入场信号:当收盘价低于所有三条均线,RSI低于50,且当前K线的最低价低于上一根K线的向下三角形。此时开空仓。
头寸大小根据选定的百分比和杠杆水平动态计算。
优势分析
这套策略结合多种指标过滤假信号,找到高概率的Breakout点位入场,极大降低了交易风险。同时,头寸按照账户权益的一定比例设定,又控制了单笔损失。
具体优势有:
使用多时间轴指标进行确认,避免被套。短线、中线和长线均线能识别不同级别的趋势。
RSI避免过热过冷区域交易。RSI高于50为看多信号,低于50为空头信号。
威廉指标进一步验证突破。仅在价格突破该指标的极值点时才入场。
动态头寸按账户金额百分比计算,严格控制单笔亏损。
可自定义参数,适应不同交易风格。
风险分析
该策略主要面临以下风险:
无法完全避免套牢的风险。当三条均线发生背离时,存在交易被套的可能。
无法在趋势反转前及时出场。指标存在滞后,无法预知反转。
亏损oom的风险。极端行情下,单笔亏损超过了预设。
对策: 1. 优化均线组合,找到最佳参数。 2. 增加阳线阴线过滤,进一步避免假突破。 3. 适当调小百分比和杠杆水平。
优化方向
该策略仍可从以下维度进行优化:
测试不同均线和RSI参数的組合,找到最优参数。
增加其他过滤指标,如币安宽度,进一步识别趋势 traderjack的信号等。
增加止损策略,在亏损达到一定比例时止损。
结合深度学习模型判断关键支撑阻力。
使用自适应百分比头寸管理系统,让头寸大小更合理。
总结
多时间轴协同交易策略是一套成熟的高频突破策略。它融合多种指标减少假信号,动态头寸严格控制单笔亏损。该策略适合有一定资金规模的私募基金和专业交易员使用。通过持续优化参数和模型,能够获得长期稳定收益。
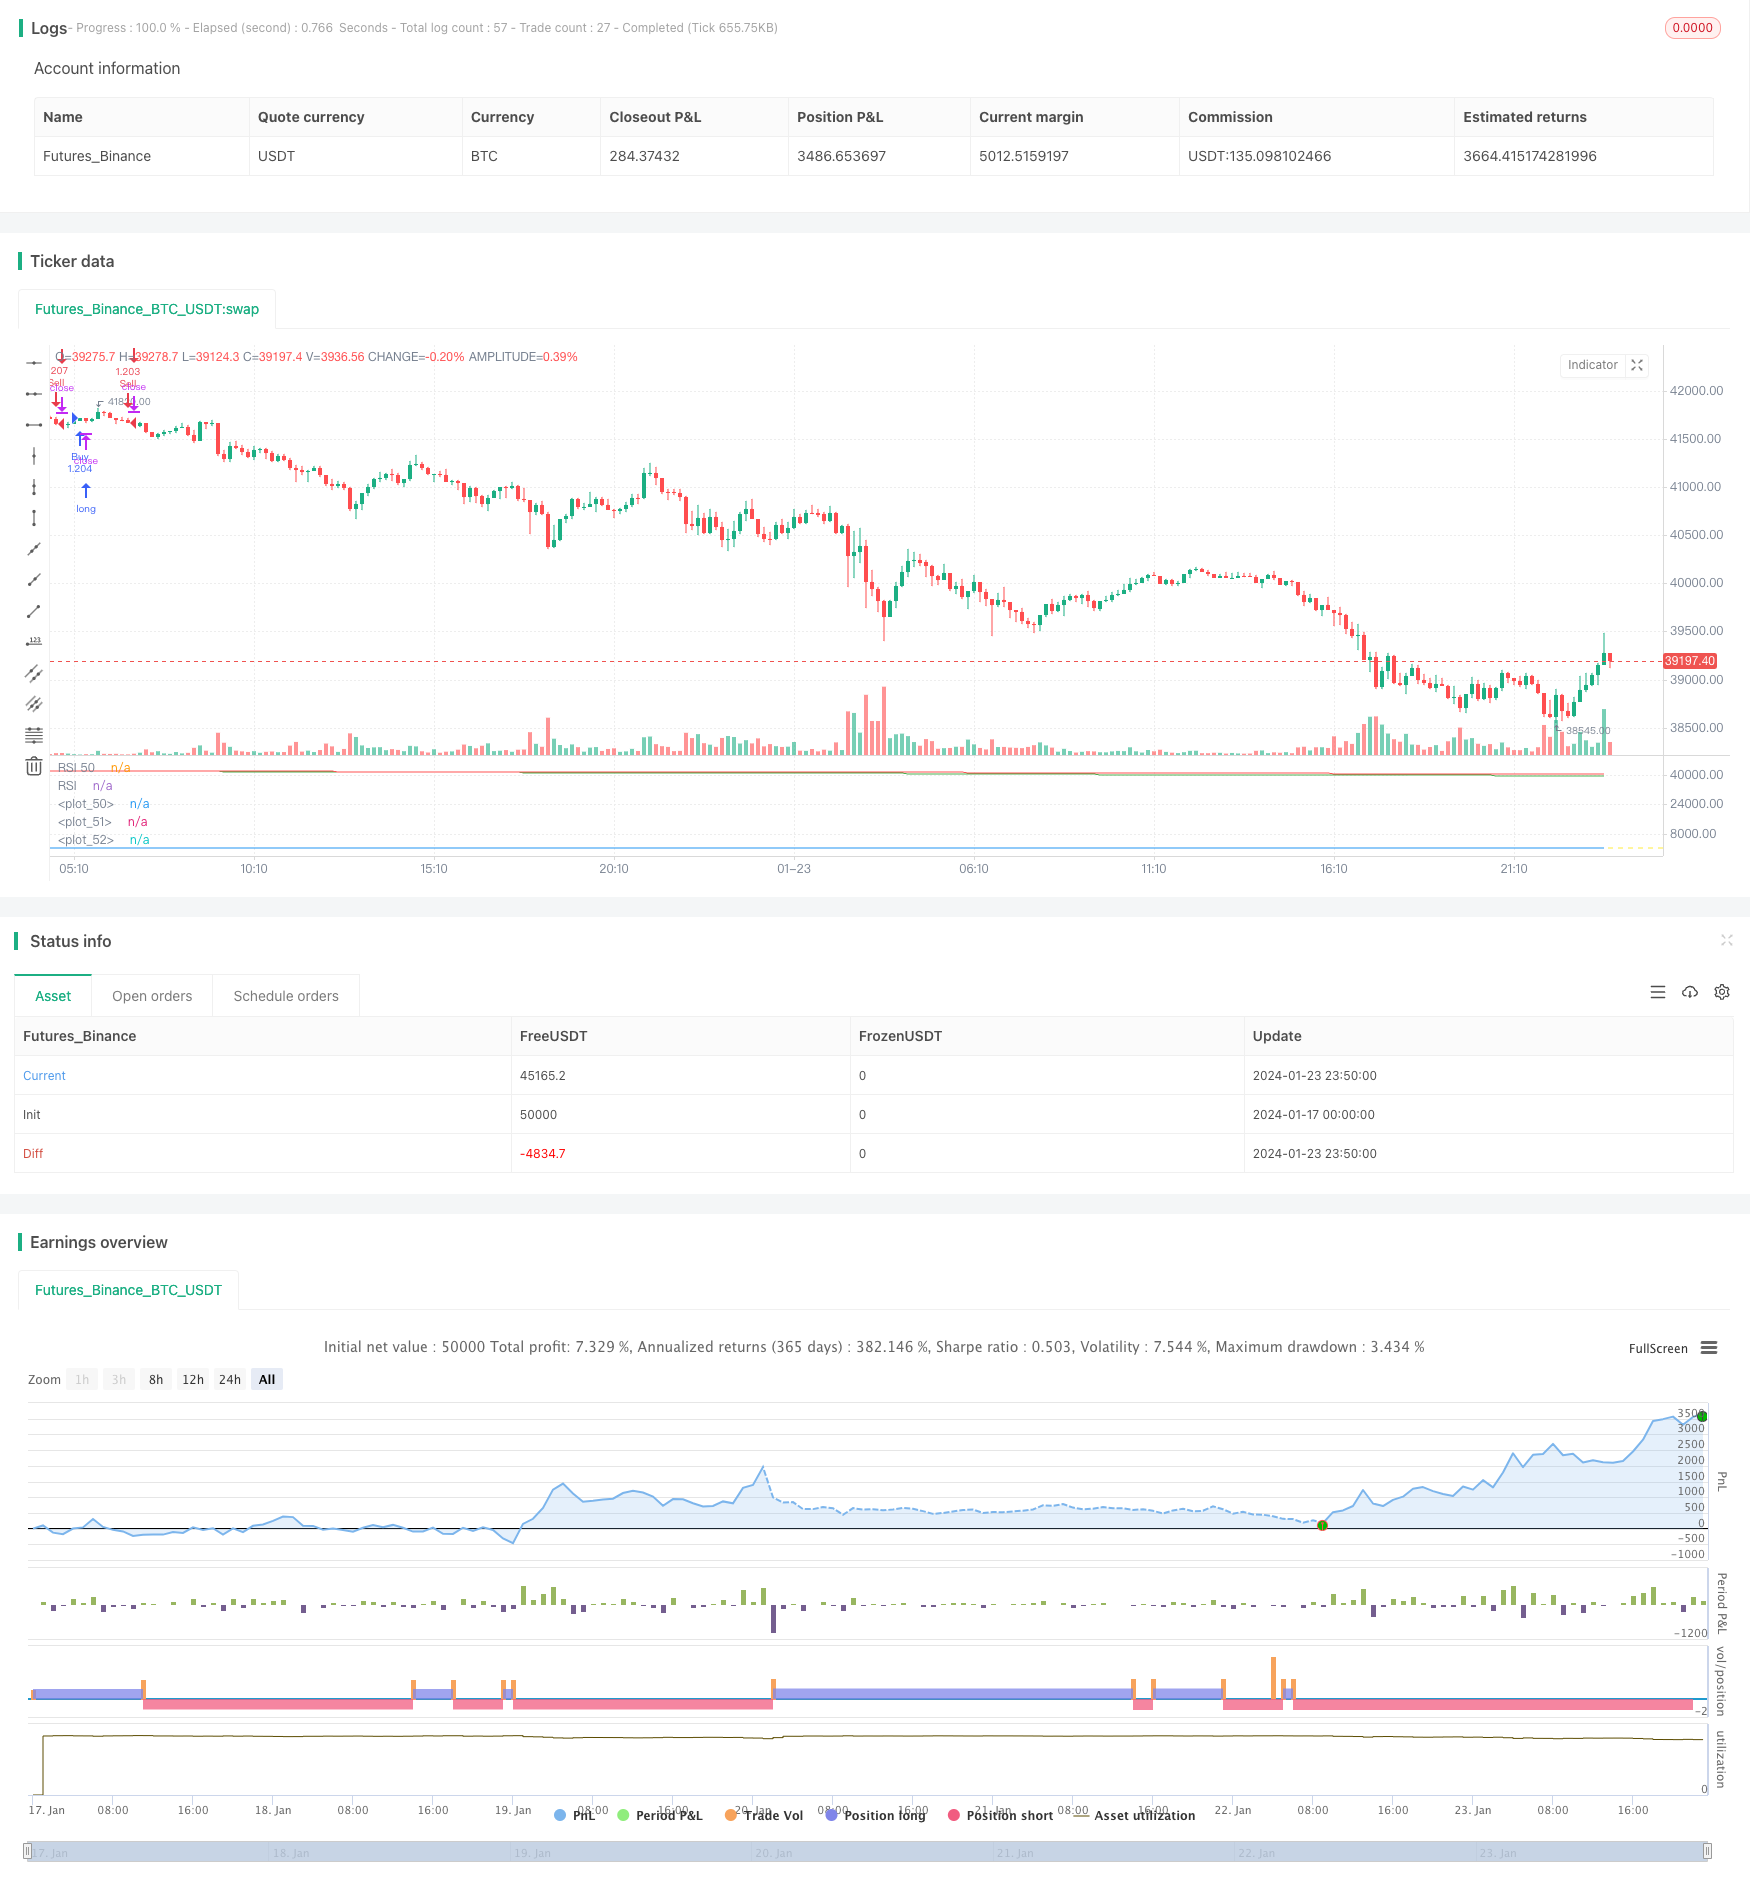
/*backtest
start: 2024-01-17 00:00:00
end: 2024-01-24 00:00:00
period: 10m
basePeriod: 1m
exchanges: [{"eid":"Futures_Binance","currency":"BTC_USDT"}]
*/

//@version=5
// Written by I3ig_Trades. Follow And Let Me Know Any Strategies You'd Like To See!
strategy("Best Scalping Strategy Period (TMA)", shorttitle="Best Scalping Strategy Period (TMA)", overlay=false,
         initial_capital=100000,
         default_qty_type=strategy.percent_of_equity,
         default_qty_value=100)

// Leverage Input
leverage = input.float(1, title="Leverage", minval=1, step=0.1)

// Calculate position size based on the percentage of the portfolio and leverage
percentOfPortfolio = input.float(100, title="Percent of Portfolio")

// Define input options
rsiLength = input.int(14, title="RSI Length", minval=1)
williamsLength = input.int(2, title="Williams Fractals Length", minval=1)
sma21Length = input.int(21, title="SMA 21 Length", minval=1)
sma50Length = input.int(50, title="SMA 50 Length", minval=1)
sma200Length = input.int(200, title="SMA 200 Length", minval=1)

// Smoothed Moving Averages
sma21 = ta.sma(close, sma21Length)
sma50 = ta.sma(close, sma50Length)
sma200 = ta.sma(close, sma200Length)

// RSI
rsiValue = ta.rsi(close, rsiLength)

// Williams Fractals
fractalUp = ta.highest(close, williamsLength)
fractalDown = ta.lowest(close, williamsLength)

// Conditions for Buy Entry
buyCondition = close > sma21 and close > sma50 and close > sma200 and rsiValue > 50 and high > fractalUp[1]

// Conditions for Sell Entry
sellCondition = close < sma21 and close < sma50 and close < sma200 and rsiValue < 50 and low < fractalDown[1]

positionSizePercent = percentOfPortfolio / 100 * leverage
positionSize = strategy.equity * positionSizePercent / close

// Executing strategy with dynamic position size
if buyCondition
    strategy.entry("Buy", strategy.long, qty=positionSize)

if sellCondition
    strategy.entry("Sell", strategy.short, qty=positionSize)

// Plotting the Smoothed Moving Averages
plot(sma21, color=color.white)
plot(sma50, color=color.green)
plot(sma200, color=color.red)

// Plotting RSI and Fractals for visual confirmation
hline(50, "RSI 50", color=color.yellow)
plot(rsiValue, color=color.blue, title="RSI")

// Input text boxes for trading actions
var buy_entry_params = input("", title="Buy Entry Parameters")
var buy_exit_params = input("", title="Buy Exit Parameters")
var sell_entry_params = input("", title="Sell Entry Parameters")
var sell_exit_params = input("", title="Sell Exit Parameters")