概述
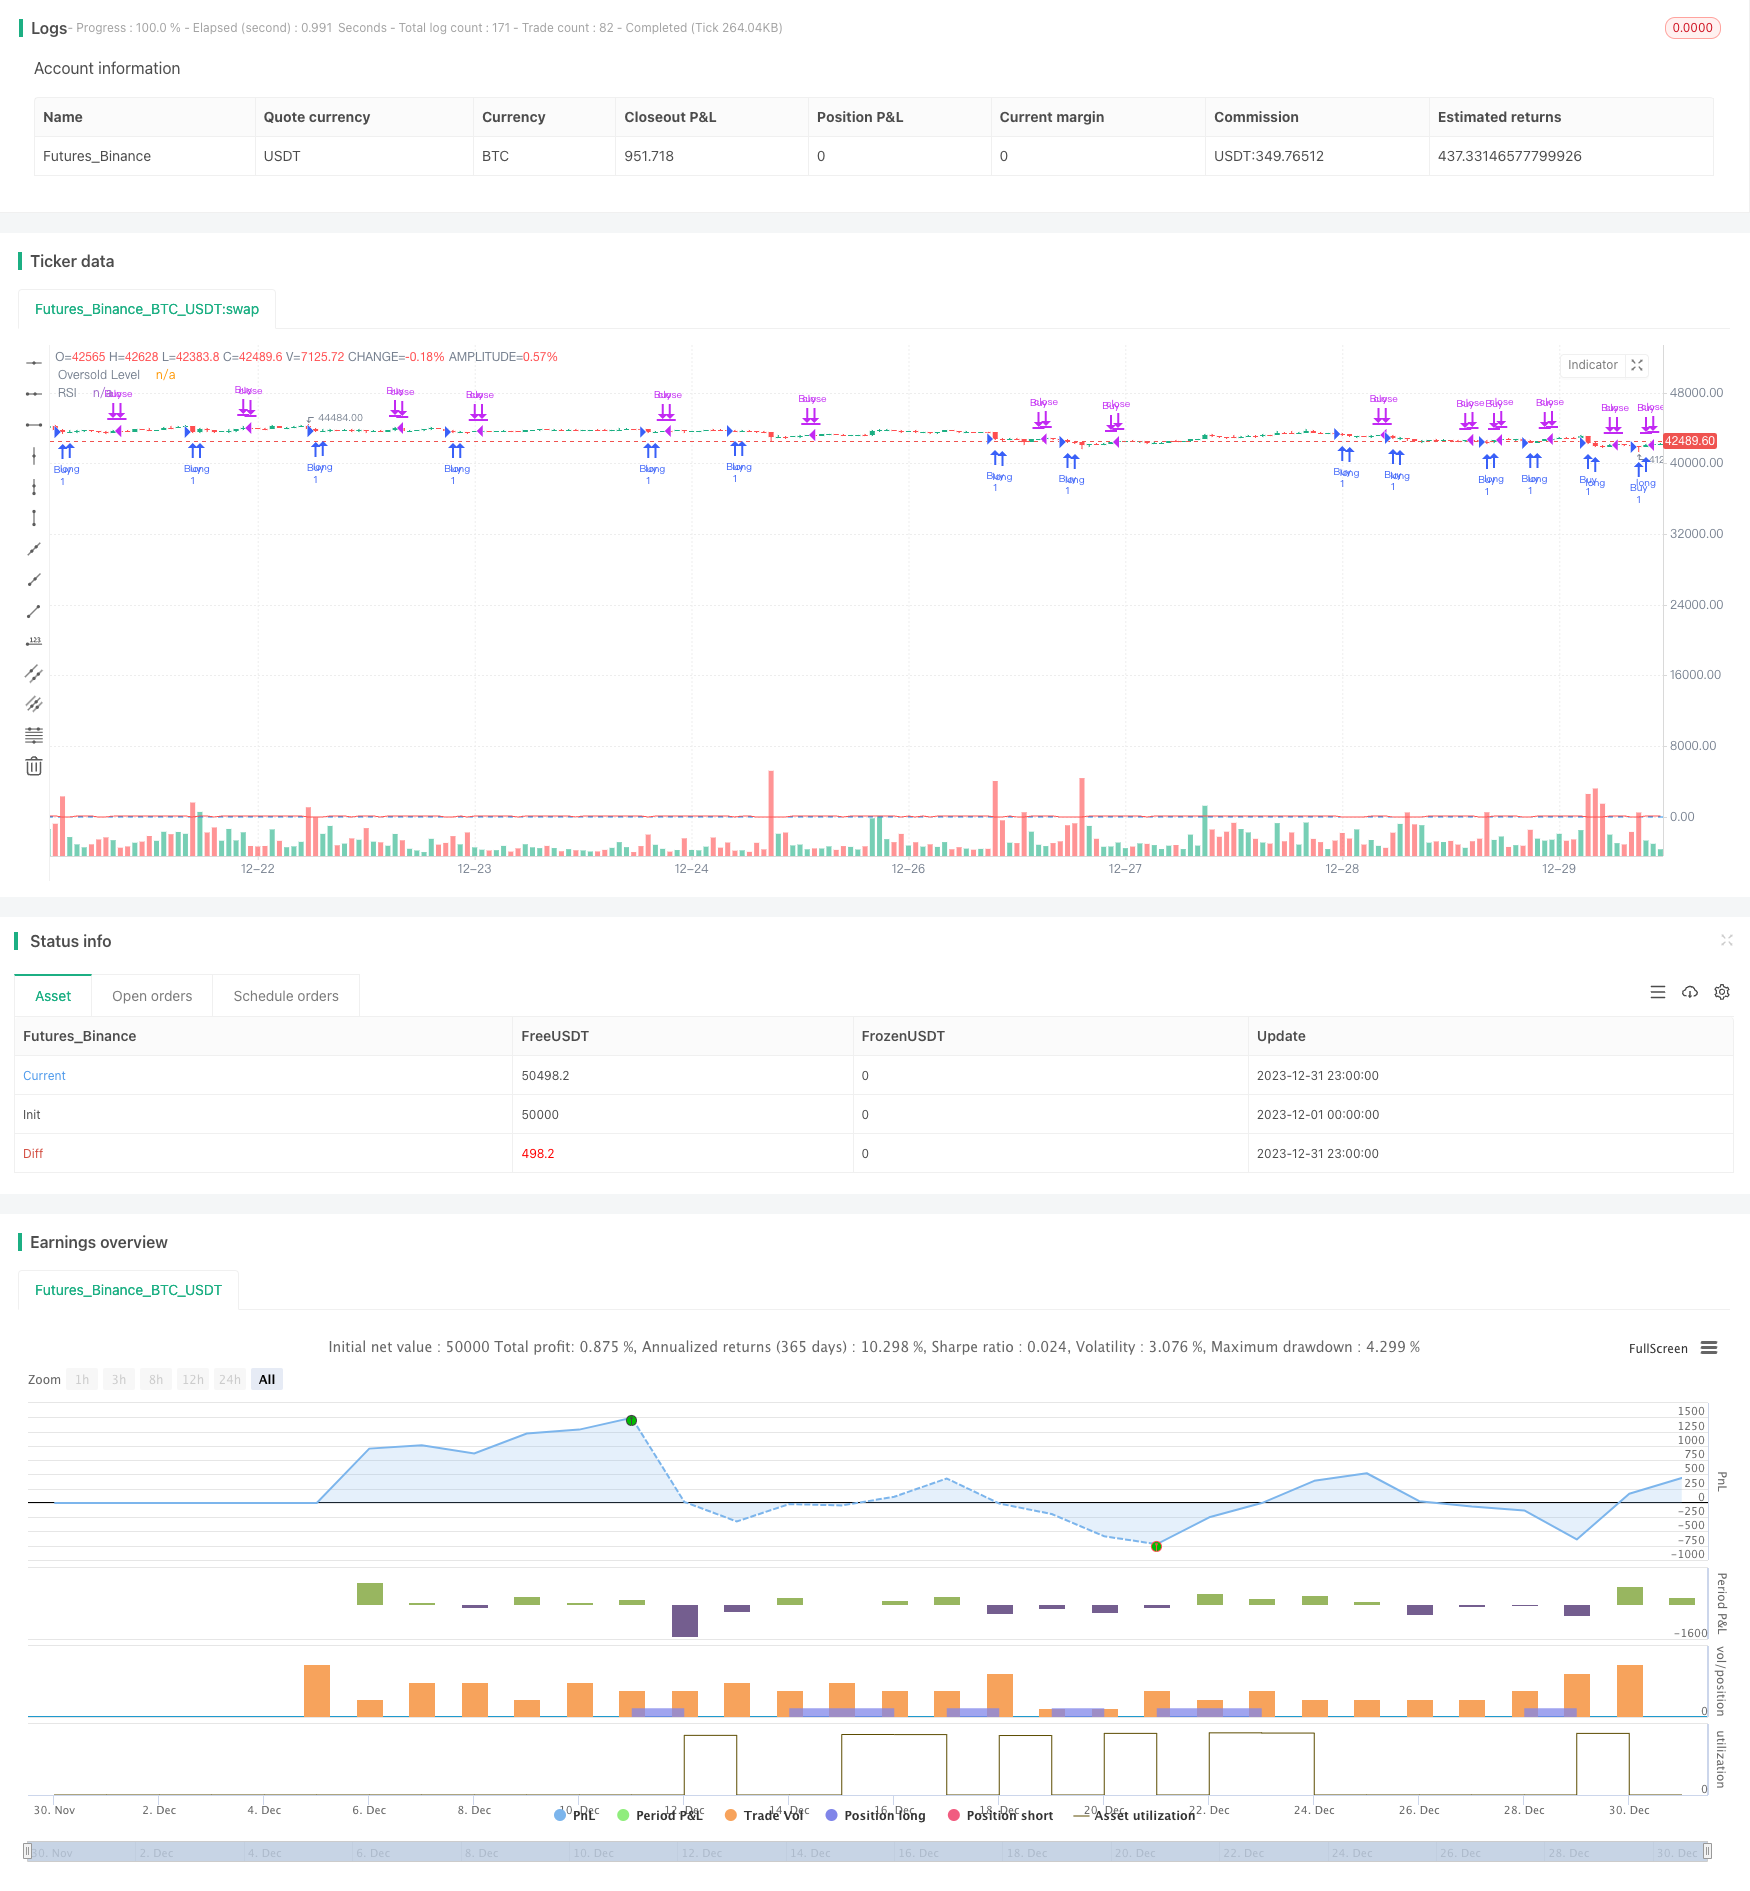
双重指标突破策略通过结合RSI指标和收盘价指标,实现低买高卖的方式进行交易。该策略简单实用,回撤风险较小,适合中长线持仓。
策略原理
该策略主要基于以下两个指标进行判断:
- RSI指标:当RSI2小于15时,做多入场。
- 前一日收盘价:当今日收盘价高于前一日的最高价时,平仓离场。
入场条件是RSI超买,表明股票被高度低估,具有较强的反转可能性。离场条件是收盘价突破前一日最高价,表明股票正在进入多头行情,应适当止盈。
优势分析
双重指标突破策略具有以下优势:
- 策略操作简单,容易实施。
- 基于双重指标,可以有效控制假信号。
- RSI指标参数优化空间大,可调整至最佳状态。
- 追踪中长线趋势,回撤风险较小。
- 可广泛适用于大中盘股票,实战效果良好。
风险分析
该策略也存在一些风险:
- 个股波动过大,RSI参数需要调整。
- 多头行情中容易预期短线回调。
- 前一日最高价突破幅度需要评估合理性。
可以通过优化RSI参数、评估行情类型、结合其他指标判断来规避上述风险。
优化方向
该策略的优化方向主要集中在以下几个方面:
- 评估不同周期的RSI指标效果。
- 测试收盘价与其他价格指标的组合。
- 增加止损机制,如离场后一段时间再重入场。
- 结合交易量变动评估入场信号的可靠性。
- 利用机器学习算法自动优化参数。
总结
双重指标突破策略整体而言是一个非常实用的量化策略。该策略操作简单,回撤风险较小,通过参数优化和规则完善可以成为聪明且稳定的量化程序。如果有效落地,可以为我们提供不错的中长线交易机会。
策略源码
/*backtest
start: 2023-12-01 00:00:00
end: 2023-12-31 23:59:59
period: 1h
basePeriod: 15m
exchanges: [{"eid":"Futures_Binance","currency":"BTC_USDT"}]
*/

// This source code is subject to the terms of the Mozilla Public License 2.0 at https://mozilla.org/MPL/2.0/
// © hobbiecode

// If RSI(2) is less than 15, then enter at the close.
// Exit on close if today’s close is higher than yesterday’s high.

//@version=5
strategy("Hobbiecode - RSI + Close previous day", overlay=true)

// RSI parameters
rsi_period = 2
rsi_lower = 15

// Calculate RSI
rsi_val = ta.rsi(close, rsi_period)

// Check if RSI is lower than the defined threshold
if (rsi_val < rsi_lower)
    strategy.entry("Buy", strategy.long)

// Check if today's close is higher than yesterday's high
if (strategy.position_size > 0 and close > ta.highest(high[1], 1))
    strategy.close("Buy")

// Plot RSI on chart
plot(rsi_val, title="RSI", color=color.red)
hline(rsi_lower, title="Oversold Level", color=color.blue)