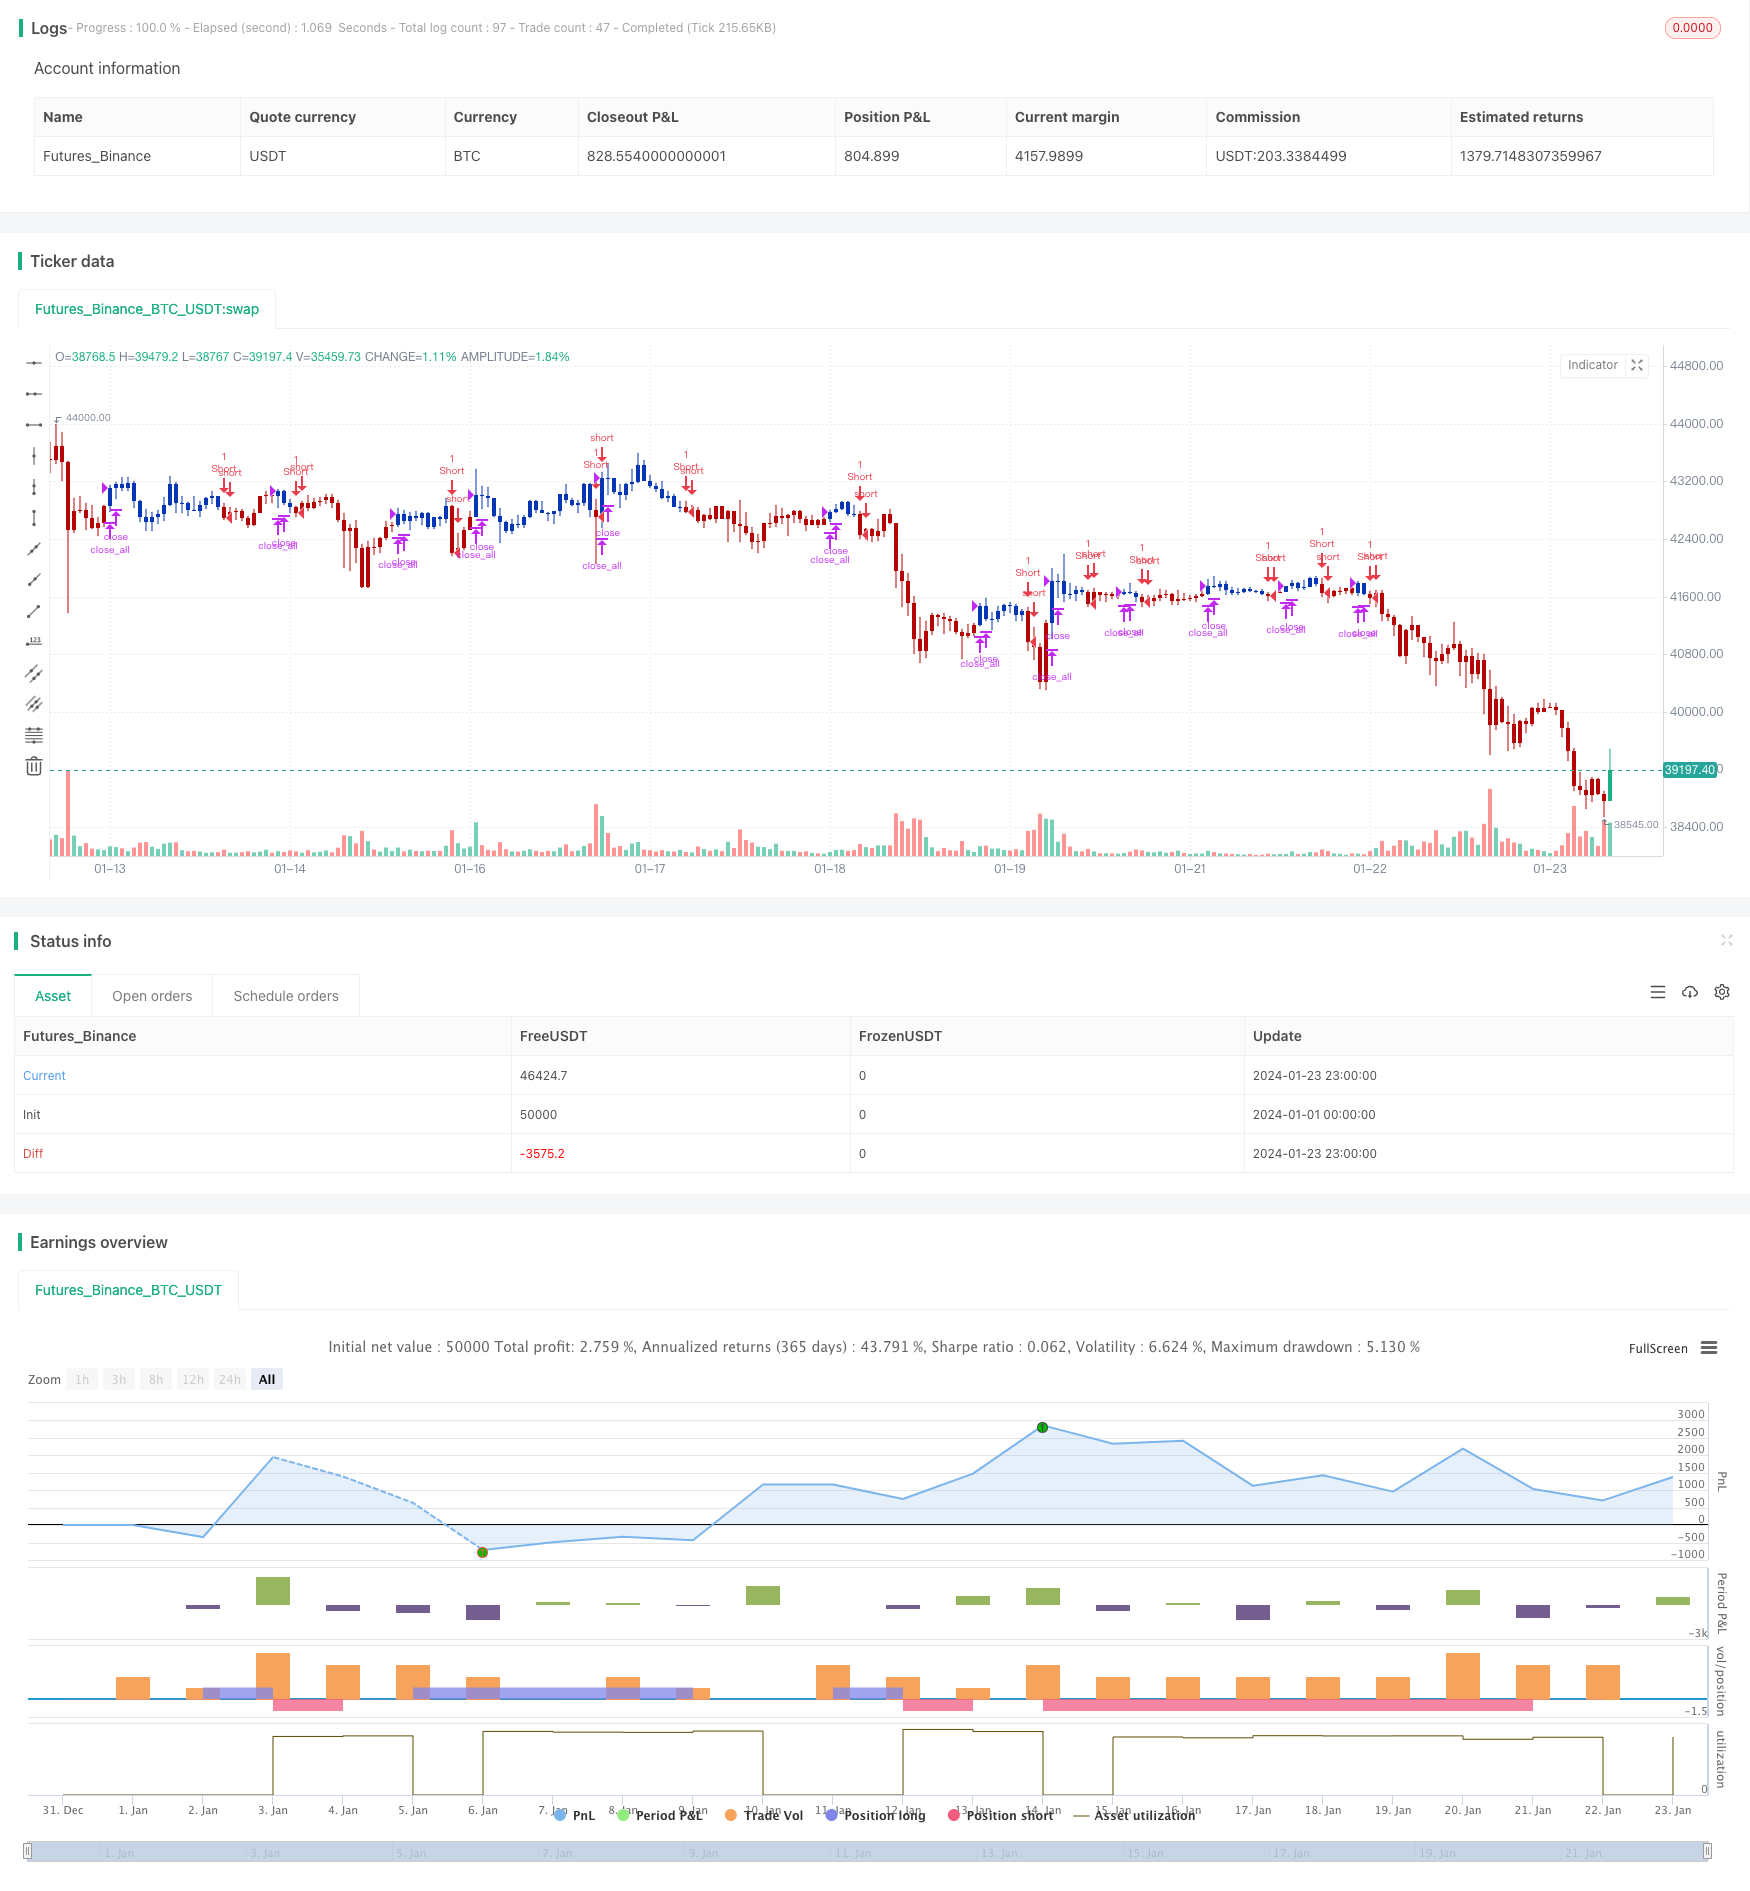
概述
双重反转震荡带趋势跟踪策略通过结合双重反转信号和震荡带指标,实现趋势跟踪交易。它首先利用123反转系统生成反转信号,然后结合Fractal Chaos Bands指标过滤信号,实现趋势跟踪。该策略既可以识别反转机会,又可以跟踪趋势,是一种非常全面的交易策略。
策略原理
123反转系统
123反转系统来源于Ulf Jensen的《我如何在期货市场获得三倍收益》一书中第183页的内容。它的交易信号是:
当收盘价连续2日高于前一日收盘价,且9日Slow K线低于50时,做多;当收盘价连续2日低于前一日收盘价,且9日Fast K线高于50时,做空。
该部分主要利用Stochastic oscillator指标在超买超卖区域生成信号。当股票连续上涨但Stochastic oscillator指标显示仍有更多空间上涨时,采取看涨策略;当股票连续下跌但Stochastic oscillator指标显示仍有更多空间下跌时,采取看跌策略。
Fractal Chaos Bands指标
Fractal Chaos Bands指标通过绘制股票价格的最高点和最低点,形成上轨和下轨,来判断市场的趋势。具体规则是:
当价格上涨突破上轨时,做多;当价格下跌突破下轨时,做空。
该部分主要作为趋势过滤,与123反转信号配合使用。只有当两者信号一致时,才会开仓。
策略优势
- 结合反转和趋势,全面捕捉机会
双重反转震荡带趋势跟踪策略既可以捕捉反转机会,也可以跟踪趋势,非常全面。无论市场是否处于震荡或趋势状态,都可以获得交易信号。
- 减少假信号,提高胜率
相比单一指标,该策略通过双重指标的结合过滤,可以大大减少假信号,提高实际交易的胜率和盈利率。
- 参数调节灵活,适应性强
双重反转震荡带趋势跟踪策略的参数都很好理解,用户可以根据自己的需要和市场环境进行调整,非常灵活。无论震荡市还是趋势市,都可以通过参数调整适应。
风险及优化
- 大趋势下无法适应
策略本身更依赖于中短线交易机会。在大的行情趋势下,该策略可能会产生过多反向信号而停损出局。这是可以通过参数调整来优化的。
- 需要边际资金支持
双重反转震荡带趋势跟踪策略属于频繁交易类型,需要有足够的边际资金来支持开仓保证金的需求。对于资金不足的用户来说,可能需要适当调小仓位。
- 可结合更多指标过滤
该策略可以在现有基础上,引入更多不同类型的指标来丰富信号源,提高策略的稳健性。比如加上量能指标、波动率指标等来检验反转和趋势信号。
总结
双重反转震荡带趋势跟踪策略成功结合反转交易和趋势跟踪的优点,既可以捕捉反转,又可以跟随趋势,非常全面和高效。相比单一指标,它可以大大减少假信号,提高实际交易的胜率和盈利水平。此外,该策略参数调节灵活,用户可以根据自己的风格和市场环境进行优化。总的来说,这是一种非常出色的量化策略,值得实盘验证。
/*backtest
start: 2024-01-01 00:00:00
end: 2024-01-24 00:00:00
period: 1h
basePeriod: 15m
exchanges: [{"eid":"Futures_Binance","currency":"BTC_USDT"}]
*/

//@version=4
////////////////////////////////////////////////////////////
//  Copyright by HPotter v1.0 21/09/2020
// This is combo strategies for get a cumulative signal.
//
// First strategy
// This System was created from the Book "How I Tripled My Money In The
// Futures Market" by Ulf Jensen, Page 183. This is reverse type of strategies.
// The strategy buys at market, if close price is higher than the previous close
// during 2 days and the meaning of 9-days Stochastic Slow Oscillator is lower than 50.
// The strategy sells at market, if close price is lower than the previous close price
// during 2 days and the meaning of 9-days Stochastic Fast Oscillator is higher than 50.
//
// Second strategy
//  Stock market moves in a highly chaotic way, but at a larger scale, the movements
// follow a certain pattern that can be applied to shorter or longer periods of time
// and we can use Fractal Chaos Bands Indicator to identify those patterns. Basically,
// the Fractal Chaos Bands Indicator helps us to identify whether the stock market is
// trending or not. When a market is trending, the bands will have a slope and if market
// is not trending the bands will flatten out. As the slope of the bands decreases, it
// signifies that the market is choppy, insecure and variable. As the graph becomes more
// and more abrupt, be it going up or down, the significance is that the market becomes
// trendy, or stable. Fractal Chaos Bands Indicator is used similarly to other bands-indicator
// (Bollinger bands for instance), offering trading opportunities when price moves above or
// under the fractal lines.
//
// The FCB indicator looks back in time depending on the number of time periods trader selected
// to plot the indicator. The upper fractal line is made by plotting stock price highs and the
// lower fractal line is made by plotting stock price lows. Essentially, the Fractal Chaos Bands
// show an overall panorama of the price movement, as they filter out the insignificant fluctuations
// of the stock price.
//
// WARNING:
// - For purpose educate only
// - This script to change bars colors.
////////////////////////////////////////////////////////////
Reversal123(Length, KSmoothing, DLength, Level) =>
    vFast = sma(stoch(close, high, low, Length), KSmoothing)
    vSlow = sma(vFast, DLength)
    pos = 0.0
    pos := iff(close[2] < close[1] and close > close[1] and vFast < vSlow and vFast > Level, 1,
	         iff(close[2] > close[1] and close < close[1] and vFast > vSlow and vFast < Level, -1, nz(pos[1], 0)))
	pos

fractalUp(pattern) =>
    p = high[pattern+1]
    okl = 1
    okr = 1
    res = 0.0
	for i = pattern to 1
		okl := iff(high[i] < high[i+1] and okl == 1 , 1, 0)
	for i = pattern+2 to pattern*2+1
		okr := iff(high[i] < high[i-1] and okr == 1, 1, 0)
	res := iff(okl == 1 and okr == 1, p, res[1])
    res

fractalDn(pattern) =>
    p = low[pattern+1]
    okl = 1
    okr = 1
    res =0.0
	for i = pattern to 1
		okl := iff(low[i] > low[i+1] and okl == 1 , 1, 0)
	for i = pattern+2 to pattern*2+1
		okr := iff(low[i] > low[i-1] and okr == 1, 1, 0)
	res := iff(okl == 1 and okr == 1, p, res[1])
    res

FCB(Pattern) =>
    pos = 0.0
    xUpper = fractalUp(Pattern)
    xLower = fractalDn(Pattern)
    pos := iff(close > xUpper, 1,
             iff(close < xLower, -1, nz(pos[1], 0)))
    pos

strategy(title="Combo Backtest 123 Reversal & Fractal Chaos Bands", shorttitle="Combo", overlay = true)
Length = input(15, minval=1)
KSmoothing = input(1, minval=1)
DLength = input(3, minval=1)
Level = input(50, minval=1)
//-------------------------
Pattern = input(1, minval=1)
reverse = input(false, title="Trade reverse")
posReversal123 = Reversal123(Length, KSmoothing, DLength, Level)
posFCB = FCB(Pattern)
pos = iff(posReversal123 == 1 and posFCB == 1 , 1,
	   iff(posReversal123 == -1 and posFCB == -1, -1, 0))
possig = iff(reverse and pos == 1, -1,
          iff(reverse and pos == -1 , 1, pos))
if (possig == 1)
    strategy.entry("Long", strategy.long)
if (possig == -1)
    strategy.entry("Short", strategy.short)
if (possig == 0)
    strategy.close_all()
barcolor(possig == -1 ? #b50404: possig == 1 ? #079605 : #0536b3 )