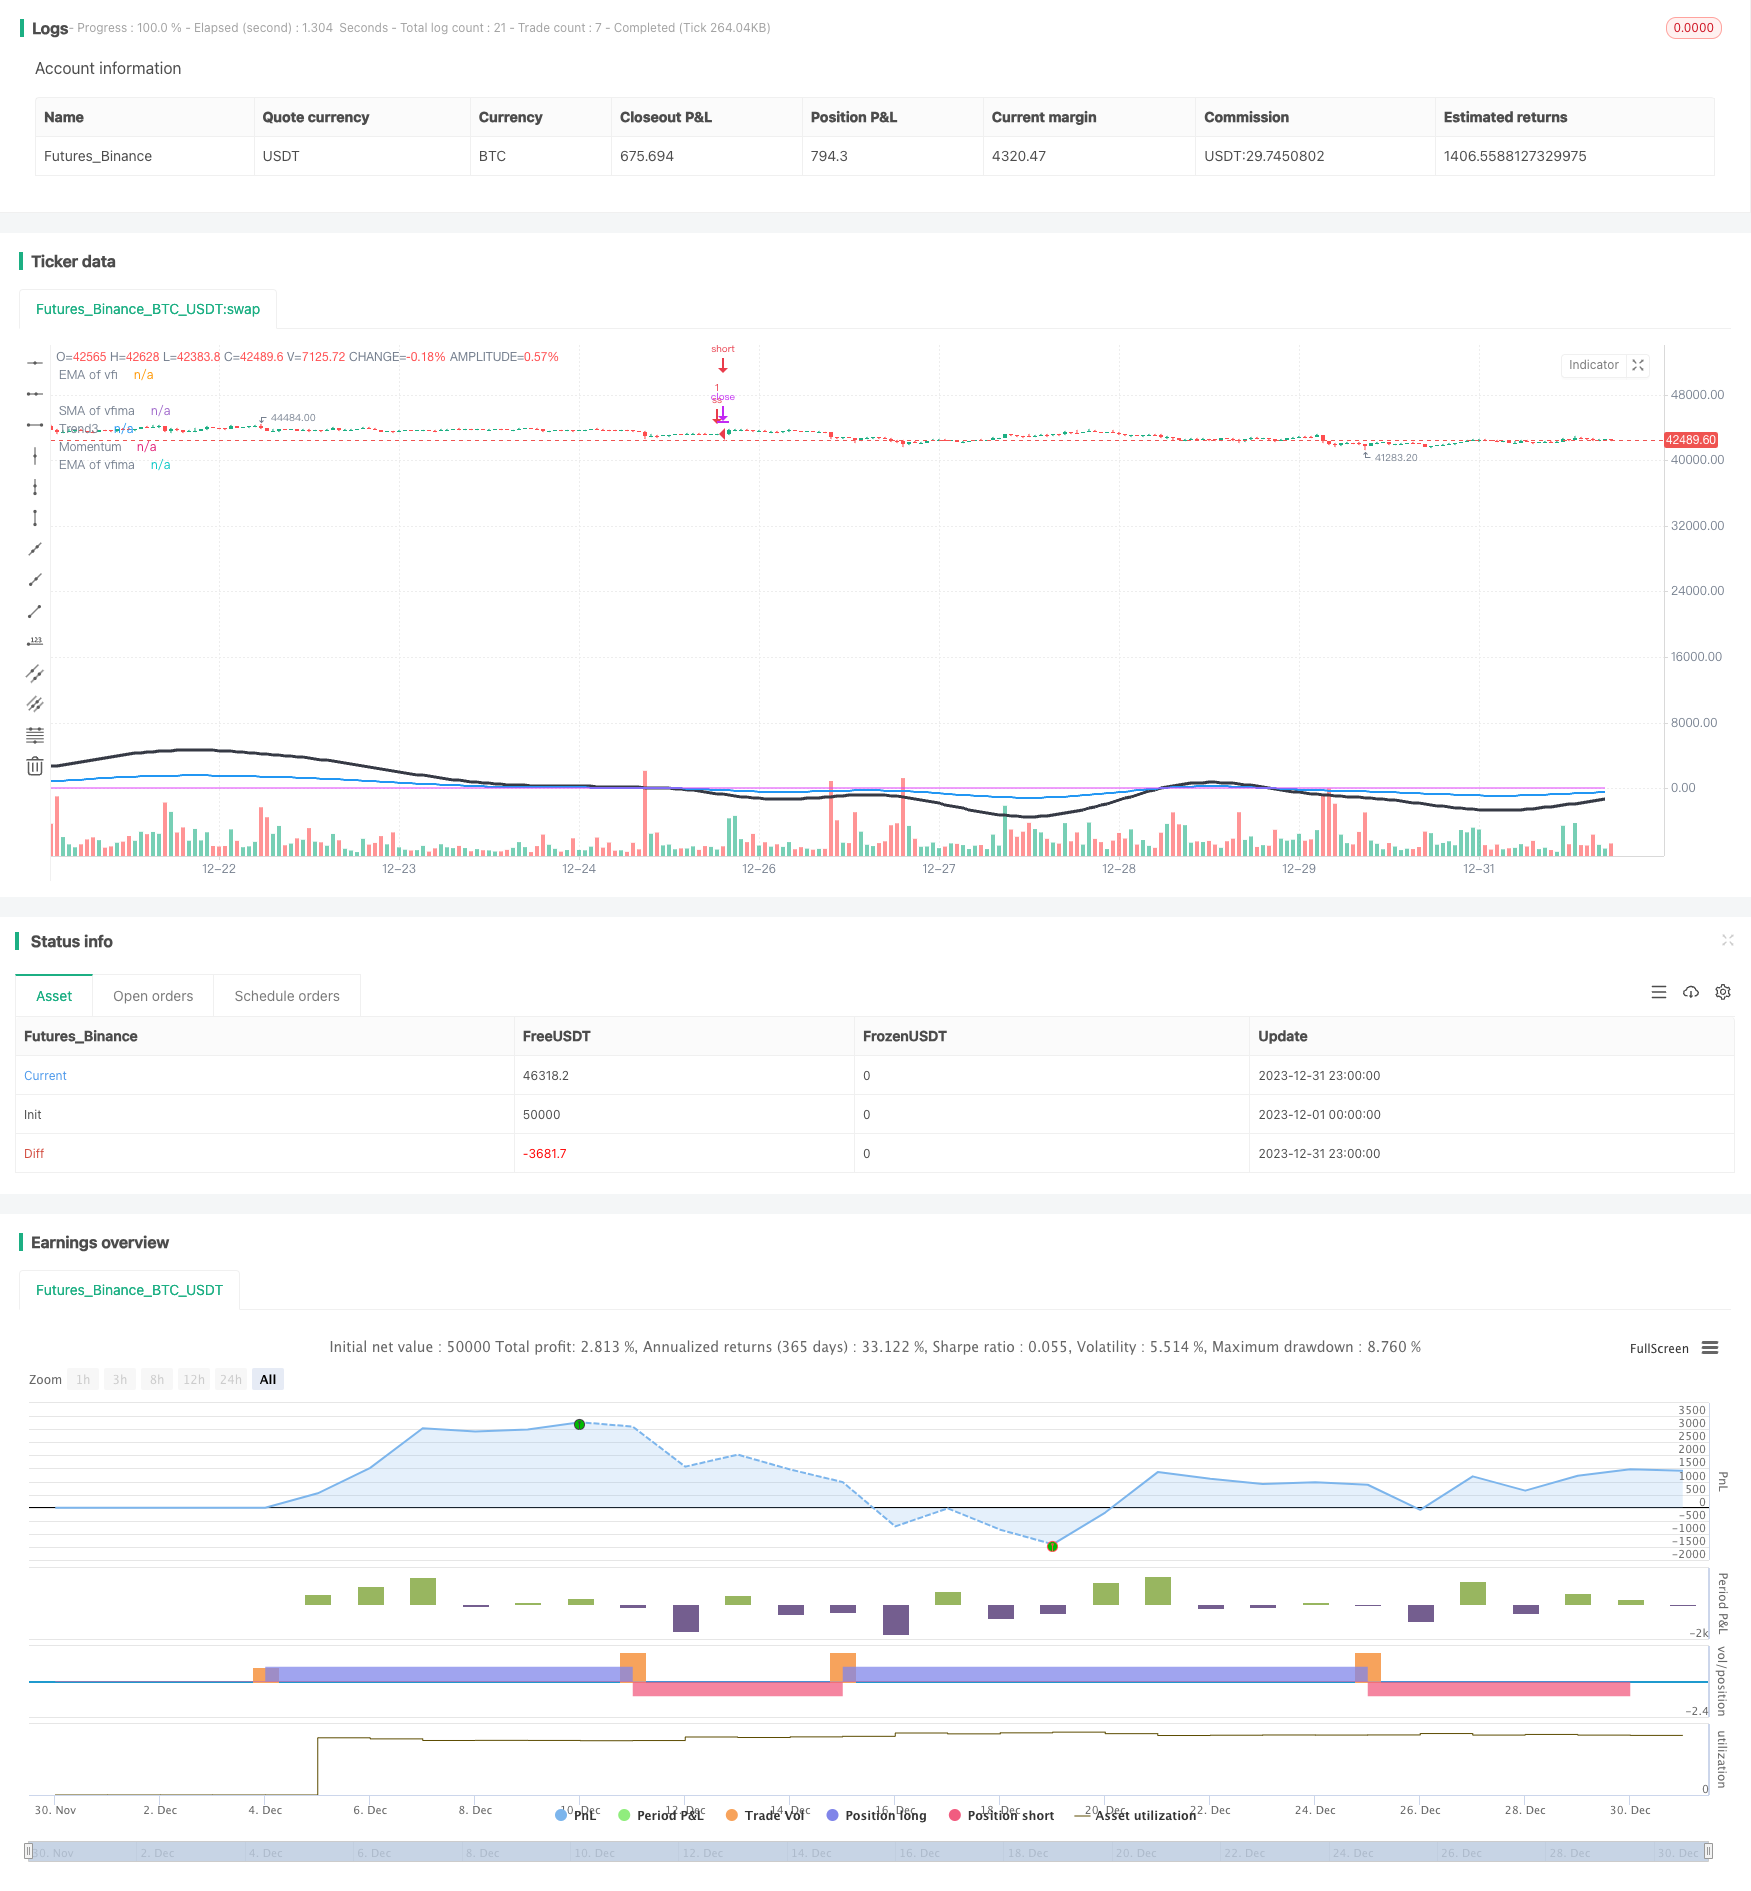
概述
该策略综合运用移动平均线、相对强弱指标(RSI)、量变动指标(VFI)以及真实强度指数(TSI)等多种技术指标,判断市场的总体动量和趋向,以捕捉中长线的价格走势。
策略原理
计算快速线RSI(7日)、正常线RSI(14日)、慢速线RSI(50日)的移动平均线,判断RSI的多空趋势和动量。
计算VFI和VFI的移动平均线EMA(25日)、SMA(25日),判断市场的资金流入流出情况。
计算TSI的长期均线和短期均线的比值,判断市场的趋势强度。
将RSI、VFI和TSI的结果进行整合,得出市场的总体动量方向。
当判断到市场存在向下的动量时,做空;当判断到市场动量反转时,将空单平仓。
优势分析
多种指标结合,判断市场总体动量和趋势更为全面和准确。
VFI反映市场资金流入流出情况,避免交易反向。
TSI过滤震荡市,使得信号更可靠。
整体来看,该策略可靠性较高,胜率较好。
风险分析
多指标结合,参数设置复杂,需要反复测试取得最优参数。
Entry和Exit策略简单,无法充分利用指标提供的信息,可能出现超短线反转亏损。
盘整震荡市中,容易产生错误信号和反向小亏损。
优化方向
优化指标参数组合,找到最佳参数。
增加Exit规则,利用指标情况判断反转退出。
增加盈利保护机制,减少盘整小亏损。
总结
本策略综合运用多种指标判断市场总体动量,在判断到市场存在向下动量时做空获利。该策略可靠性较高,但Entry和Exit机制较简单,指标信息没有得到充分利用。通过不断优化参数和增强Exit规则,可进一步提高策略稳定性和盈利能力。
]
策略源码
//@version=2
//credit to LazyBear, Lewm444, and others for direct and indirect inputs/////////////////////////////////
//script is very rough, publishing more for collaborative input value than as a finished product/////////
strategy("Momo", overlay=true)
length = input( 50 )
overSold = input( 50 )
overBought = input( 65 )
price = ohlc4

/////////////////////////////////////////////////////macd/////////////////////////////////////////////////

fastLength = input(12)
slowlength = input(26)
MACDLength = input(9)

fast = 12, slow = 26
fastMA = ema(close, fast)
slowMA = ema(close, slow)
MACD = (fastMA - slowMA)
Msignal = (sma(MACD, 9))*40
//plot(Msignal, color=blue, linewidth=3)

/////////////////////////////////////////////////rsi spread/////////////////////////////////////////////////

source = price

RSIFast  = rsi(source, input(7))
RSINorm  = rsi(source, input(14))
RSISlow = rsi(source, input(50))

//plot(RSIFast, color=silver, style=area, histbase=50)
//plot(RSINorm, color=#98b8be, style=area, histbase=50)
//plot(RSISlow, color=#be9e98, style=area, histbase=50)

//plot(RSIFast, color=gray, style=line, linewidth=1)
//plot(RSINorm, color=purple, style=line, linewidth=2)
//plot(RSISlow, color=black, style=line, linewidth=3)

exponential = input(true, title="Exponential MA")

src = (RSIFast)

ma05 = exponential ? ema(src, 05) : sma(src, 05)
ma30 = exponential ? ema(src, 30) : sma(src, 30)
ma50 = exponential ? ema(src, 50) : sma(src, 50)
ma70 = exponential ? ema(src, 70) : sma(src, 70)
ma90 = exponential ? ema(src, 90) : sma(src, 90)
ma100 = exponential ? ema(src, 100) : sma(src, 100)

exponential1 = input(true, title="Exponential MA")

src1 = (RSINorm)

ma051 = exponential1 ? ema(src1, 05) : sma(src1, 05)
ma301 = exponential1 ? ema(src1, 30) : sma(src1, 30)
ma501 = exponential1 ? ema(src1, 50) : sma(src1, 50)
ma701 = exponential1 ? ema(src1, 70) : sma(src1, 70)
ma901 = exponential1 ? ema(src1, 90) : sma(src1, 90)
ma1001 = exponential1 ? ema(src1, 100) : sma(src1, 100)


exponential2 = input(true, title="Exponential MA")

src2 = (RSINorm)

ma052 = exponential2 ? ema(src2, 05) : sma(src2, 05)
ma302 = exponential2 ? ema(src2, 30) : sma(src2, 30)
ma502 = exponential2 ? ema(src2, 50) : sma(src2, 50)
ma702 = exponential2 ? ema(src2, 70) : sma(src2, 70)
ma902 = exponential2 ? ema(src2, 90) : sma(src2, 90)
ma1002 = exponential2 ? ema(src2, 100) : sma(src2, 100)


////////////////////////////////////////////////vfi by LazyBear, modified////////////////////////////////////

VFIlength = input(130, title="VFI length")
coef = input(0.2)
vcoef = input(2.5, title="Max. vol. cutoff")
signalLength=input(10)
signalLength2 = input(100)
smoothVFI=input(false, type=bool)

ma(x,y) => smoothVFI ? sma(x,y) : x

typical=hlc3
inter = log( typical ) - log( typical[1] )
vinter = stdev(inter, 30 )
cutoff = coef * vinter * close
vave = sma( volume, VFIlength )[1]
vmax = vave * vcoef
vc = iff(volume < vmax, volume, vmax) //min( volume, vmax )
mf = typical - typical[1]
vcp = iff( mf > cutoff, vc, iff ( mf < -cutoff, -vc, 0 ) )

vfi = ma(sum( vcp , VFIlength )/vave, 3)
vfima = ema( vfi, 25 )
vfimaS = (sma(vfima, 25))
zima = ema( vfima, signalLength2 )
d=vfi-vfima
vfi_avg = avg(vfi, vfima, vfimaS)
vfi_avgS = (sma(vfi_avg,5))

plot( zima, title="EMA of vfima", color=fuchsia, linewidth=1)
plot( vfimaS, title="SMA of vfima", color=blue, linewidth=1)
plot( vfima , title="EMA of vfi", color=black, linewidth=1)
//plot( vfi, title="vfi", color=green,linewidth=1)
//plot( vfi_avg, title="vfi_avg", color=blue, linewidth=2)
//plot( vfi_avgS, title="vfi_avgS", color=maroon, linewidth=2)

/////////////////////////////////////////////////////tsi////////////////////////////////////////////////

long2 = input(title="Long Length",  defval=24)
short2 = input(title="Short Length",  defval=7)
signal2 = input(title="Signal Length",  defval=13)
pc = change(price)
double_smooth2(src, long2, short2) =>
    fist_smooth2 = ema(src, long2)
    ema(fist_smooth2, short2)
double_smoothed_pc2 = double_smooth2(pc, long2, short2)
double_smoothed_abs_pc2 = double_smooth2(abs(pc), long2, short2)
tsi_value2 = 60 * (double_smoothed_pc2 / double_smoothed_abs_pc2)
//plot( tsi_value2, title="tsi2", color=black, linewidth=1)

////////////////////////////////////////////////////////mjb////////////////////////////////////////////////

trendSignal = avg(tsi_value2, Msignal, vfi)*1.75
T1 = sma(trendSignal, 5)
T2 = ema(trendSignal, 25)
T3 = ema(T2, 25)
//plot( T1, title="Trend", color=red, linewidth=3)
plot( T3, title="Trend3", color=black, linewidth=3)

/////////////////////////////////////////////////////mjb////////////////////////////////////////////////

Momentum = avg (T3, vfimaS, vfima)
plot( Momentum, title="Momentum", color=blue, linewidth=2)
vrsi = rsi(price, length)
clearance = abs(zima - Msignal)

/////////////////////////////////////////////////////mjb////////////////////////////////////////////////

if (not na(vrsi))
    if (zima > T3) and (clearance > 5) and (falling(zima, 1) == 1) and (zima > vfimaS) and (zima > vfima) and (falling(T3, 1) == 1) and (zima > 6)
        strategy.entry("ss", strategy.short)
    if (T3 > zima) and (rising(zima, 1) == 1)
        strategy.entry("Zcover", strategy.long)
    if (strategy.openprofit > 750) and (rising(T2, 1) == 1) and (T2 > 10)
        strategy.entry("ProfitTake", strategy.long)
// strategy.risk.allow_entry_in(strategy.direction.short)
// strategy.risk.max_intraday_loss(2000, strategy.cash)