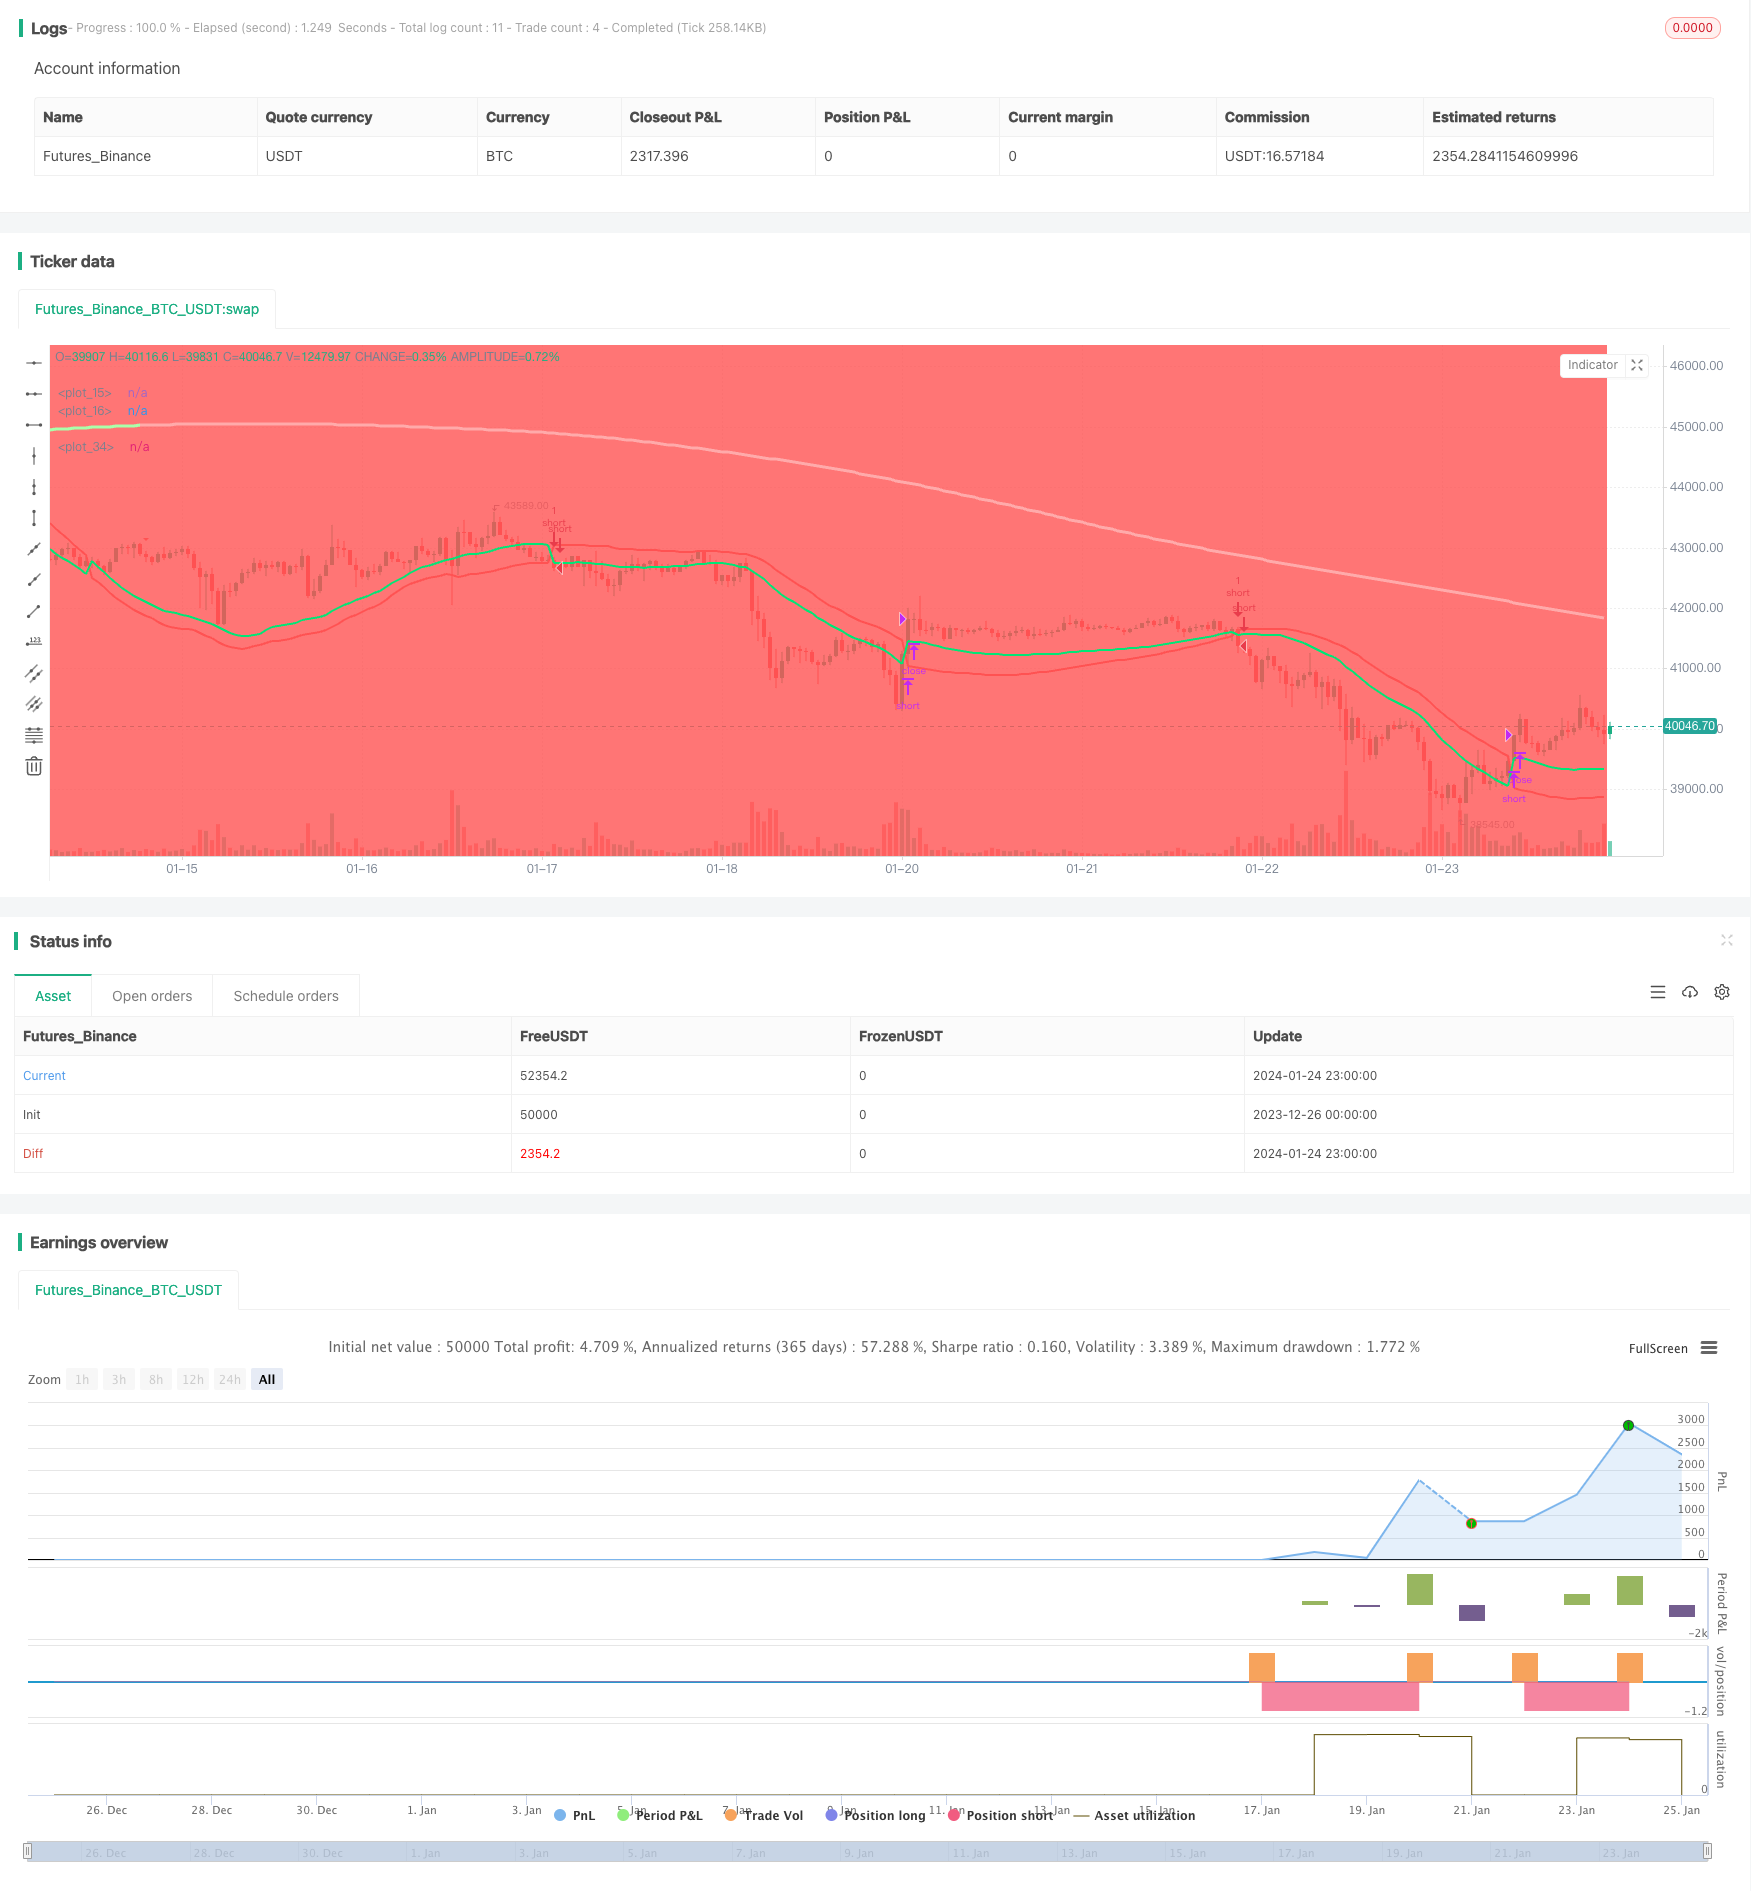
Linear Regression and Dual Moving Average Short-Term Strategy

Author: ChaoZhang, Date: 2024-01-26 12:33:14
Tags:

img

Overview

This strategy combines linear regression indicators and dual exponential moving averages to implement short-term tracking operations. The strategy establishes short positions when prices break through the upper and lower rails, and closes positions when prices break through again. At the same time, this strategy also uses dual exponential moving averages to determine price trends as an auxiliary condition for establishing positions.

Strategy Principle

This strategy mainly uses linear regression indicators to determine price breakouts. The linear regression indicator is calculated based on the highest and lowest prices over a certain period using linear regression to obtain upper and lower rails. When prices break down from the upper rail or break up from the lower rail, we believe it is a trading signal.

In addition, this strategy also introduces dual exponential moving averages to determine the interim trend. Dual exponential moving averages can respond faster to price changes. When prices break down from the upper rail, if the dual exponential moving average is already above the price at this time, it indicates that it is currently in a downward trend. We will establish short positions. When prices break through the upper rail again or break through the dual exponential moving average, we will flatten positions.

Specifically, the main points of the strategy include:

  1. Calculate linear regression upper and lower rails
  2. Calculate dual exponential moving average
  3. When the price breaks down from the upper rail and the dual exponential moving average is above the price, establish short positions
  4. When prices break through the upper rail again or are above the dual exponential moving average, flatten short positions

Advantage Analysis

Compared with traditional moving average and other indicators, this strategy has the following advantages:

  1. Linear regression indicators can capture price changes faster and are more effective as entry signals
  2. Dual exponential moving averages determine trends more sensitively and can avoid false breakouts
  3. Combining dual indicators and conditions can filter out some noise and make trading more stable

Risk Analysis

This strategy also has some risks to note:

  1. Linear regression indicators are sensitive to parameters and different cycles may produce different results
  2. Dual exponential moving averages may deviate and judge wrongly
  3. Breakthrough strategies may increase slippage risks
  4. Frequent opening and closing of positions may occur in volatile markets

For the above risks, we can solve them by parameter optimization, strict stop loss, appropriately relaxing the breakthrough amplitude, etc.

Optimization Directions

This strategy can also be optimized in the following aspects:

  1. Optimize linear regression cycle and dual exponential moving average cycle to find the best parameter combination
  2. Add price volatility judgment to avoid errors caused by slight price breakthroughs
  3. Increase auxiliary conditions such as trading volume to ensure the effectiveness of breakthroughs
  4. Set stop loss levels to reduce single loss
  5. Adjust parameters for specific varieties

Summary

This strategy comprehensively uses linear regression indicators and dual exponential moving averages, which has certain advantages in theory and practice. Further improvements in stability and strategy results can be achieved through continuous optimization and adjustment. This strategy is suitable for short-term operations and can bring good alpha to quantitative traders.


/*backtest
start: 2023-12-26 00:00:00
end: 2024-01-25 00:00:00
period: 1h
basePeriod: 15m
exchanges: [{"eid":"Futures_Binance","currency":"BTC_USDT"}]
*/

//@version=4
strategy('LR&SSL_Short', overlay=true)
startP = timestamp(input(2017, "Start Year"), input(12, "Month"), input(17, "Day"), 0, 0)
end   = timestamp(9999,1,1,0,0)
_testPeriod() => true

len = input(title="Period", defval=89)
smaHigh = linreg(high, len, 0)
smaLow = linreg(low, len, -1)
Hlv = 0.0
Hlv := close > smaHigh ? 1 : close < smaLow ? -1 : Hlv[1]
sslDown = Hlv < 0 ? smaHigh : smaLow
sslUp = Hlv < 0 ? smaLow : smaHigh

plot(sslDown, linewidth=2, color=color.red)
plot(sslUp, linewidth=2, color=color.lime)


length = input(200, title="DEMA") 
d1 = ema(close, length)                                               
d2 = 2 * d1 - ema(d1, length)                                         
trendColour = d2 > d1 ? #AAFFAA : #FFAAAA 
dema=sma(d2,length) 

turnGreen = d2 > d1 and d2[1] <= d1[1]  
turnRed   = d2 <= d1 and d2[1] > d1[1]  

up =turnGreen 
down=turnRed 
  
plotshape(down, title="down", style=shape.triangledown,location=location.abovebar, color=color.red, transp=0, size=size.small) 
plotshape(up,  title="up", style=shape.triangleup,location=location.belowbar, color=color.green, transp=0, size=size.small) 
plot(dema, color = trendColour,linewidth=3 ,transp = 0)
bgcolor(close > dema ? color.green : color.red)

strategy.entry("short", strategy.short, when= crossunder(sslUp, sslDown) and dema > close and _testPeriod())
strategy.close("short", when = crossover(sslUp, sslDown) or crossover(close, dema))


More