概述
双均线交叉 golden cross 交易策略利用两条不同周期的移动平均线的交叉作为买入和卖出信号。具体来说,当短周期移动平均线从下方向上突破长周期移动平均线时,产生黄金交叉信号,表示行情转 bull;当短周期移动平均线从上方向下跌破长周期移动平均线时,产生死亡交叉信号,表示行情转 bear。
策略原理
该策略基于两个原理:
移动平均线能反映市场趋势和力量。短周期移动平均线能捕捉市场最近动向和转折点;长周期移动平均线表现了市场主要趋势。
短周期移动平均线与长周期移动平均线形成黄金交叉时,表示短期行情力量超过长期趋势力量,所以很可能开始新的上涨行情。形成死亡交叉时,表示长期下跌趋势占主导,所以很可能持续下跌。
具体来说,该策略设置13周期和30周期的简单移动平均线,并在它们交叉时产生交易信号。交叉原理如下:
当短周期移动平均线上穿长周期移动平均线时,产生黄金交叉信号,表示做多机会。这时,通过评估趋势坚挺性入场:若价格维持上涨超过一定周期,就有信心当前是上涨趋势,那么做多。
当短周期移动平均线下穿长周期移动平均线时,产生死亡交叉信号,表示做空机会。这时,通过评估趋势坚挺性入场:若价格维持下跌超过一定周期,就有信心当前是下跌趋势,那么做空。
通过移动平均线坡度评估交叉信号强度。只有当短期和长期移动平均线坡度差大于某阈值时,才认为交叉信号足够强势,值得入场。这抑制了普通 false 信号的干扰。
止损设定为20%,止盈为100%。
优势分析
双均线交叉策略有以下优势:
思路清晰简单,容易理解和实现,适合新手。
利用价格平均特征,有一定的去噪音作用,避免被短期价格波动误导。
评估趋势坚挺性,避免机械地做多做空,而是结合大盘判断。
引入移动平均线坡度动量因子,使信号更加可靠。
回测优化简单,只需要调整移动平均线参数和趋势坚挺性时间等少数关键参数。
风险分析
该策略也存在以下风险:
双均线交叉本质依然是滞后信号,不能完美预测转折点,存在一定程度的延迟。应适当缩短移动平均线周期,或与能预测转折点的因子配合使用。
机械交易系统容易集体同时出击,从而加剧行情过度,使止损或止盈失效。应设置成阶梯止损止盈,或适当人工干预。
不能很好处理震荡行情,应避开这类周期内反复横盘的品种,选择清晰方向的品种进行交易。
评估趋势坚挺性的时间窗口设定得当与否对结果影响很大,要反复测试确定最佳值。
优化方向
双均线交叉策略还可从以下方面进行优化:
增加评估大级别趋势的指标,避免逆势操作。例如加入比较周线或月线的位置。
加入交易量的验证,仅在成交量放大的情况下发出信号,避免虚假信号。
优化移动平均线参数,寻找最佳周期组合。可以尝试自适应移动平均线参数。
结合主流公式指标,如MACD、KD等辅助判断,提高信号准确率。
设置阶梯式止损止盈,更好控制风险。
总结
双均线交叉策略整体而言是一个非常直观可解释的策略思路。它融合了移动平均线的去噪特性,与交叉判定简单的趋势识别能力。同时,对信号进行一定验证,避免盲目跟风,这也使其实用性和稳定性提高。除了本文提到的几个改进思路外,该策略仍有很大优化空间,值得深入研究。
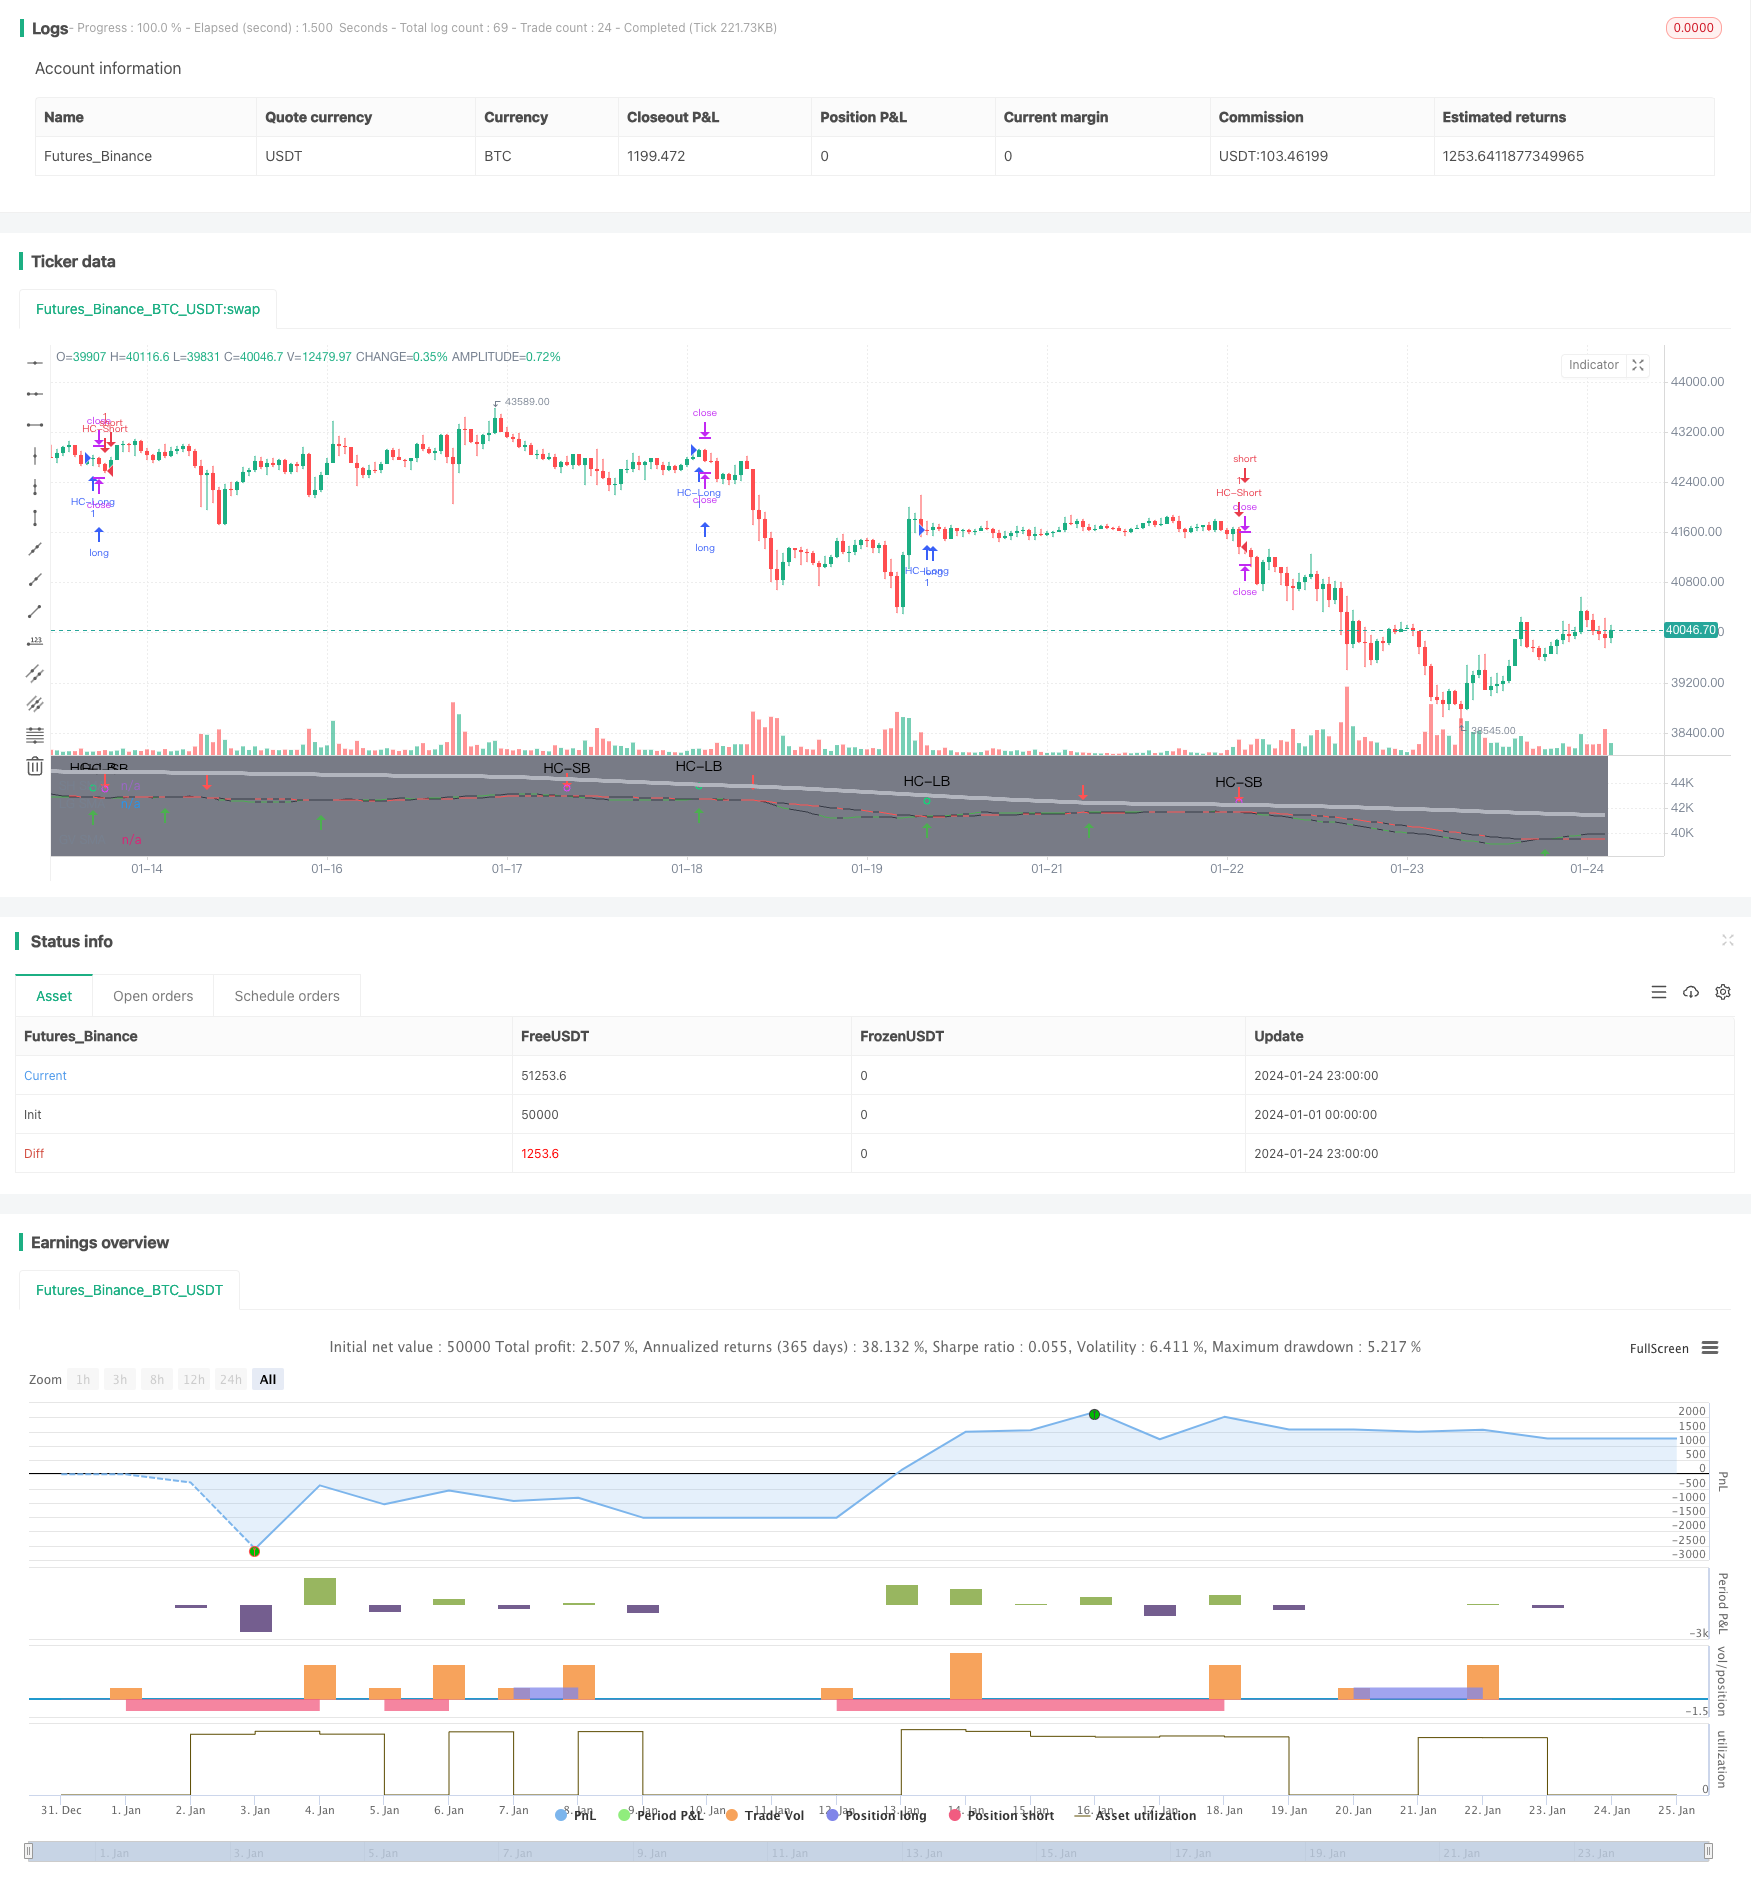
/*backtest
start: 2024-01-01 00:00:00
end: 2024-01-25 00:00:00
period: 1h
basePeriod: 15m
exchanges: [{"eid":"Futures_Binance","currency":"BTC_USDT"}]
*/

//@version=4

// This source code is subject to the terms of the Mozilla Public License 2.0 at https://mozilla.org/MPL/2.0/
// © MakeMoneyCoESTB2020


//*********************Notes for continued work***************

//************************************************************

//Hello my fellow investors
//I am creating a simple non-cluttered strategy that uses 3(+1) simple means to determine: viability, entry, and exit
//1) Has a consistent trend been maintained for several days/weeks
//2) SH SMA crossover LG SMA = Bullish entry/LG SMA crossover SH SMA = Bearish entry
//3) Use the Slope factor & Weeks in Trend (WiT) to dertermine how strong of an entry signal you are comfortable with
//4) Exit position based on next SMA cross and trend reversal or stop loss%
//3+1) For added confidence in trend detection: Apply MACD check - buy--> MACD line above signal line and corssover below histogram \\ sell --> MACD line below signal line and crossover above histogram.
//*)This code also allows you to determine your desired backtesting date compliments of alanaster


//This code is the product of many hours of hard work on the part of the greater tradingview community.  The credit goes to everyone in the community who has put code out there for the greater good.

//Happy Hunting!

// 1. Define strategy settings*************************************************************************************************************************************************************************

//Title
strategy("KISS Strategy: SMA + EMA", shorttitle="KISS Strat")

//define calculations price source
price = input(title="Price Source", defval=close)

// 2. Calculate strategy values*************************************************************************************************************************************************************************

//Calculate 13/30/200SMA
SH_SMA_length= input(title="SH SMA Length", defval=13) //short SMA length
LG_SMA_length= input(title="LG SMA Length", defval=30) //long SMA length
GV_SMA_length= input(title="SH SMA Length", defval=200) //Gravitational SMA length

SH_SMA=sma(price, SH_SMA_length) //short SMA
LG_SMA=sma(price, LG_SMA_length) //long SMA
GV_SMA=sma(price, GV_SMA_length) //gravitational SMA

//calculate MACD
//define variables for speed
fast = 12, slow = 26
//define parameters to calculate MACD
fastMA = ema(price, fast)
slowMA = ema(price, slow)
//define MACD line
macd = fastMA - slowMA
//define SIGNAL line
signal = sma(macd, 9)

//Determine what type of trend we are in
dcp = security(syminfo.tickerid, 'D', close)   //daily close price
wcp = security(syminfo.tickerid, 'W', close)   //weekly close price

WiT = input(title="Weeks In Trend", defval=1, maxval=5, minval=1)    //User input for how many weeks of price action to evaluate (Weeks in Trend = WiT)
BearTrend = false       //initialize trend variables as false
BullTrend = false       //initialize trend variables as false

// BullTrend := (wcp > SH_SMA) and (SH_SMA > LG_SMA)  //true if price is trending up based on weekly price close
// BearTrend := (wcp < SH_SMA) and (SH_SMA < LG_SMA)  //true if price is trending down based on weekly price close


// BullTrend := (price > SH_SMA) and (SH_SMA > LG_SMA)  //true if price is trending up
// BearTrend := (price < SH_SMA) and (SH_SMA < LG_SMA)  //true if price is trending down

//Determine if the market has been in a trend for 'n' weeks

n=WiT                           //create loop internal counting variable
for i=1 to WiT                  //create loop to determine if BearTrend=true to set number of weeks
    if (wcp[n] < price)         //evaluate if BearTrend=false comparing the current price to a paticular week close
        BearTrend := false      //set value to false if older price value is less than newer: trending up
        break                   //break out of for loop when trend first falters
    if (wcp[n] > price)         //evaluate if BearTrend=true comparing the current price to a paticular week close
        BearTrend := true       //set value to true if older price value is greater than newer: trending down
    n:=n-1                      //set internal counter one day closer to present

m=WiT                           //create loop internal counting variable
for j=1 to WiT                  //create loop to determine if BearTrend=true to set number of weeks
    if (wcp[m] > price)         //evaluate if BullTrend=false comparing the current price to a paticular week close
        BullTrend := false      //set value to false if older price value is greater than newer: trending down
        break                   //break out of for loop when trend first falters
    if (wcp[m] < price)         //evaluate if BullTrend=true comparing the current price to a paticular week close
        BullTrend := true       //set value to true if older price value is less than newer: trending up
    m:=m-1                      //set internal counter one day closer to present


//Determine if crossings occur
SH_LGcrossover = crossover(SH_SMA, LG_SMA)  //returns true if short crosses over long
SH_LGcrossunder = crossunder(SH_SMA, LG_SMA)    //returns true if short crosses under long

//Determine the slope of the SMAs when a cross over occurs
SlopeFactor= input(title="Slope Factor", defval=.01, minval=0, step = 0.001) //user input variable for what slope to evaluate against
XSlopeSH = abs(SH_SMA-SH_SMA[2]) //slope of short moving average (time cancels out)
XSlopeLG = abs(LG_SMA-LG_SMA[2]) //slope of long moving average (time cancels out)
StrongSlope = iff (abs(XSlopeSH-XSlopeLG)>SlopeFactor, true, false) //create a boolean variable to determine is slope intensity requirement is met

// ************************************ INPUT BACKTEST RANGE ******************************************=== coutesy of alanaster
fromMonth = input(defval = 4,    title = "From Month",      type = input.integer, minval = 1, maxval = 12)
fromDay   = input(defval = 1,    title = "From Day",        type = input.integer, minval = 1, maxval = 31)
fromYear  = input(defval = 2020, title = "From Year",       type = input.integer, minval = 1970)
thruMonth = input(defval = 1,    title = "Thru Month",      type = input.integer, minval = 1, maxval = 12)
thruDay   = input(defval = 1,    title = "Thru Day",        type = input.integer, minval = 1, maxval = 31)
thruYear  = input(defval = 2112, title = "Thru Year",       type = input.integer, minval = 1970)

// === INPUT SHOW PLOT ===
showDate  = input(defval = true, title = "Show Date Range", type = input.bool)

// === FUNCTION EXAMPLE ===
start     = timestamp(fromYear, fromMonth, fromDay, 00, 00)        // backtest start window
finish    = timestamp(thruYear, thruMonth, thruDay, 23, 59)        // backtest finish window
window()  => true

bgcolor(color = showDate and window() ? color.gray : na, transp = 90)
// === EXECUTION ===
//strategy.entry("L", strategy.long, when = window() and crossOv)    // enter long when "within window of time" AND crossover
//strategy.close("L", when = window() and crossUn)                   // exit long when "within window of time" AND crossunder

// 3. Output strategy data*************************************************************************************************************************************************************************

//Embolden line if a trend exists
trendcolorLG = BearTrend?color.red:color.black //highlights beartrend condition met graphically
trendcolorSH = BullTrend?color.green:color.black //highlights beartrend condition met graphically

//plot SMAs
plot(SH_SMA, title = "SH SMA", color = trendcolorSH)
plot(LG_SMA, title = "LG SMA", color = trendcolorLG)
plot(GV_SMA, title = "GV SMA", color = color.silver, linewidth = 4, transp = 70)

//Highlight crossovers
plotshape(series=SH_LGcrossover, style=shape.arrowup, location=location.belowbar,size=size.normal, color=color.green)
plotshape(series=SH_LGcrossunder, style=shape.arrowdown, location=location.abovebar,size=size.normal, color=color.red)

// 4. Determine Long & Short Entry Calculations*************************************************************************************************************************************************************************

//Define countback variable
countback=input(minval=0, maxval=5, title="Price CountBack", defval=0)
//User input for what evaluations to run: SMA or SMA + EMA
SMA_Y_N=input(defval = "Y", title="Run SMA", type=input.string, options=["Y", "N"])
MACD_Y_N=input(defval = "N", title="Run MACD", type=input.string, options=["Y", "N"])

//Calculate SMA Cross entry conditions
SMAbuy=false
SMAsell=false
SMAbuy := SH_LGcrossover and StrongSlope and BearTrend[WiT*7]   //enter long if short SMA crosses over long SMA & security has been in a BearTrend for 'n' days back
SMAsell := SH_LGcrossunder and StrongSlope and BullTrend[WiT*7] //enter short if short SMA crosses under long SMA & security has been in a BullTrend for 'n' days back

//Calculate MACD Cross entry conditions
MACDbuy = iff(MACD_Y_N=="Y", crossunder(signal[countback], macd[countback]), true) and iff(MACD_Y_N=="Y", macd[countback]<0, true) and StrongSlope and BearTrend     //enter long if fast MACD crosses over slow MACD & there is a strong slope & security has been in a BearTrend for 'n' days back
MACDsell = iff(MACD_Y_N=="Y", crossunder(macd[countback], signal[countback]), true) and iff(MACD_Y_N=="Y", signal[countback]>0, true) and StrongSlope and BullTrend  //enter short if fast MACD crosses under slow MACD & there is a strong slope & security has been in a BullTrend for 'n' days back

//long entry condition
dataHCLB=(iff(SMA_Y_N=="Y", SMAbuy, true) and iff(MACD_Y_N=="Y", MACDbuy, true))
plotshape(dataHCLB, title= "HC-LB", color=color.lime, style=shape.circle, text="HC-LB")
strategy.entry("HC-Long", strategy.long, comment="HC-Long", when = dataHCLB and window())

//short entry condition
dataHCSB=(iff(SMA_Y_N=="Y", SMAsell, true) and iff(MACD_Y_N=="Y", MACDsell, true))
plotshape(dataHCSB, title= "HC-SB", color=color.fuchsia, style=shape.circle, text="HC-SB")
strategy.entry("HC-Short", strategy.short, comment="HC-Short", when=dataHCSB and window())


// 5. Submit Profit and Loss Exit Calculations Orders*************************************************************************************************************************************************************************

// User Options to Change Inputs (%)
stopPer = input(12, title='Stop Loss %', type=input.float) / 100
takePer = input(25, title='Take Profit %', type=input.float) / 100

// Determine where you've entered and in what direction
longStop = strategy.position_avg_price * (1 - stopPer)
shortStop = strategy.position_avg_price * (1 + stopPer)
shortTake = strategy.position_avg_price * (1 - takePer)
longTake = strategy.position_avg_price * (1 + takePer)

//exit position conditions and orders
if strategy.position_size > 0//or crossunder(price[countback], upperBB)
    strategy.exit(id="Close Long", when = window(), stop=longStop, limit=longTake)
if strategy.position_size < 0 //or crossover(price[countback], lowerBB)
    strategy.exit(id="Close Short", when = window(), stop=shortStop, limit=shortTake)


//Evaluate/debug equation***************************************************************************************************************************************************************************
// plotshape((n==5? true : na), title='n=5', style=shape.labeldown, location=location.abovebar, text='5', color=color.white, textcolor=color.black, transp=0) //print n value if 5
// plotshape((n==4? true : na), title='n=4', style=shape.labeldown, location=location.abovebar, text='4', color=color.white, textcolor=color.black, transp=0) //print n value if 4
// plotshape((n==3? true : na), title='n=3', style=shape.labeldown, location=location.abovebar, text='3', color=color.white, textcolor=color.black, transp=0) //print n value if 3
// plotshape((n==2? true : na), title='n=2', style=shape.labeldown, location=location.abovebar, text='2', color=color.white, textcolor=color.black, transp=0) //print n value if 2
// plotshape((n==1? true : na), title='n=1', style=shape.labeldown, location=location.abovebar, text='1', color=color.white, textcolor=color.black, transp=0) //print n value if 1
// lineValue = 11                                           //set random visible line value to check when equation is true
// colorP = (BearTrend==true) ? color.green : color.red
// plot (lineValue, title = "BearTrend", color = colorP)   //Plot when condition true=green, false=red
// plot (XSlopeLG+15, color=color.white) //used for code debugging
// plot (XSlopeSH+15, color=color.blue) //used for code debugging
// plot (abs(XSlopeSH-XSlopeLG)+20, color=color.fuchsia) //used for code debugging