概述(Overview)
本策略基于股票的二年新高价格和移动平均线的唯一计算方法。当股票价格创出二年新高后回调至13日指数移动平均线时,产生买入信号。
策略原理(Strategy Principle)
本策略的核心逻辑基于以下唯一的计算方法:
当股票价格创出二年以来的最高价后,会形成一个短期的价格高点。这是一个比较关键的价格点。
当价格从这个新高点下跌,回调到13日指数移动平均线时,就是一个比较好的买入机会。这是利用了价格的中枢特征。
此外,买入信号发出时,股票价格必须在二年新高价的10%范围内,不能太远。并且要低于13日线而高于21日线,这保证了买入的时机选择。
对于持有的仓位,如果价格跌破21日线5%或距离二年新高下跌20%,就区间止损了结利润。
策略优势(Strategy Advantages)
这是一个长线的突破策略,具有以下优势:
利用二年高点这一独特价格,可以有效判断潜在趋势反转机会。
13日指数移动平均线作为入市依据,可以有效过滤震荡,确定较强势头。
唯一的计算方法,利用价格特征来发出信号,避免主观臆断。
适当考虑止损,可以锁定大部分利润。
策略风险及解决方法(Risks and Solutions)
该策略也存在一些风险,主要有:
行情可能出现深度回调,无法全部止损。此时需要评估大环境,确定是否果断止损。
隔夜大缺口的情况下,无法完美止损。这需要适当放宽止损幅度作为应对。
13日线过滤震荡的效果可能不理想,产生过多错误信号。此时可以适当延长至21日线。
新高描述的趋势转折点效果可能不佳,可考虑改用其它指标结合。
策略优化建议(Strategy Optimization Suggestions)
该策略还存在可优化的空间:
可以引入其他工具判断大环境,避免不必要持仓。
增加量能指标等判断力度,进一步避免误入震荡区间。
优化移动平均线参数,使其更能抓住价格特征。
利用机器学习方法动态优化二年新高价参数,使策略更灵活。
总结(Conclusion)
本策略整体来说是比较独特的长线突破思路,关键点在于利用二年新高这个重要价格进行判断,并以13日指数移动平均线作为过滤和入场依据。该策略有一定优势,但也存在可优化的空间,值得进一步探索研究。
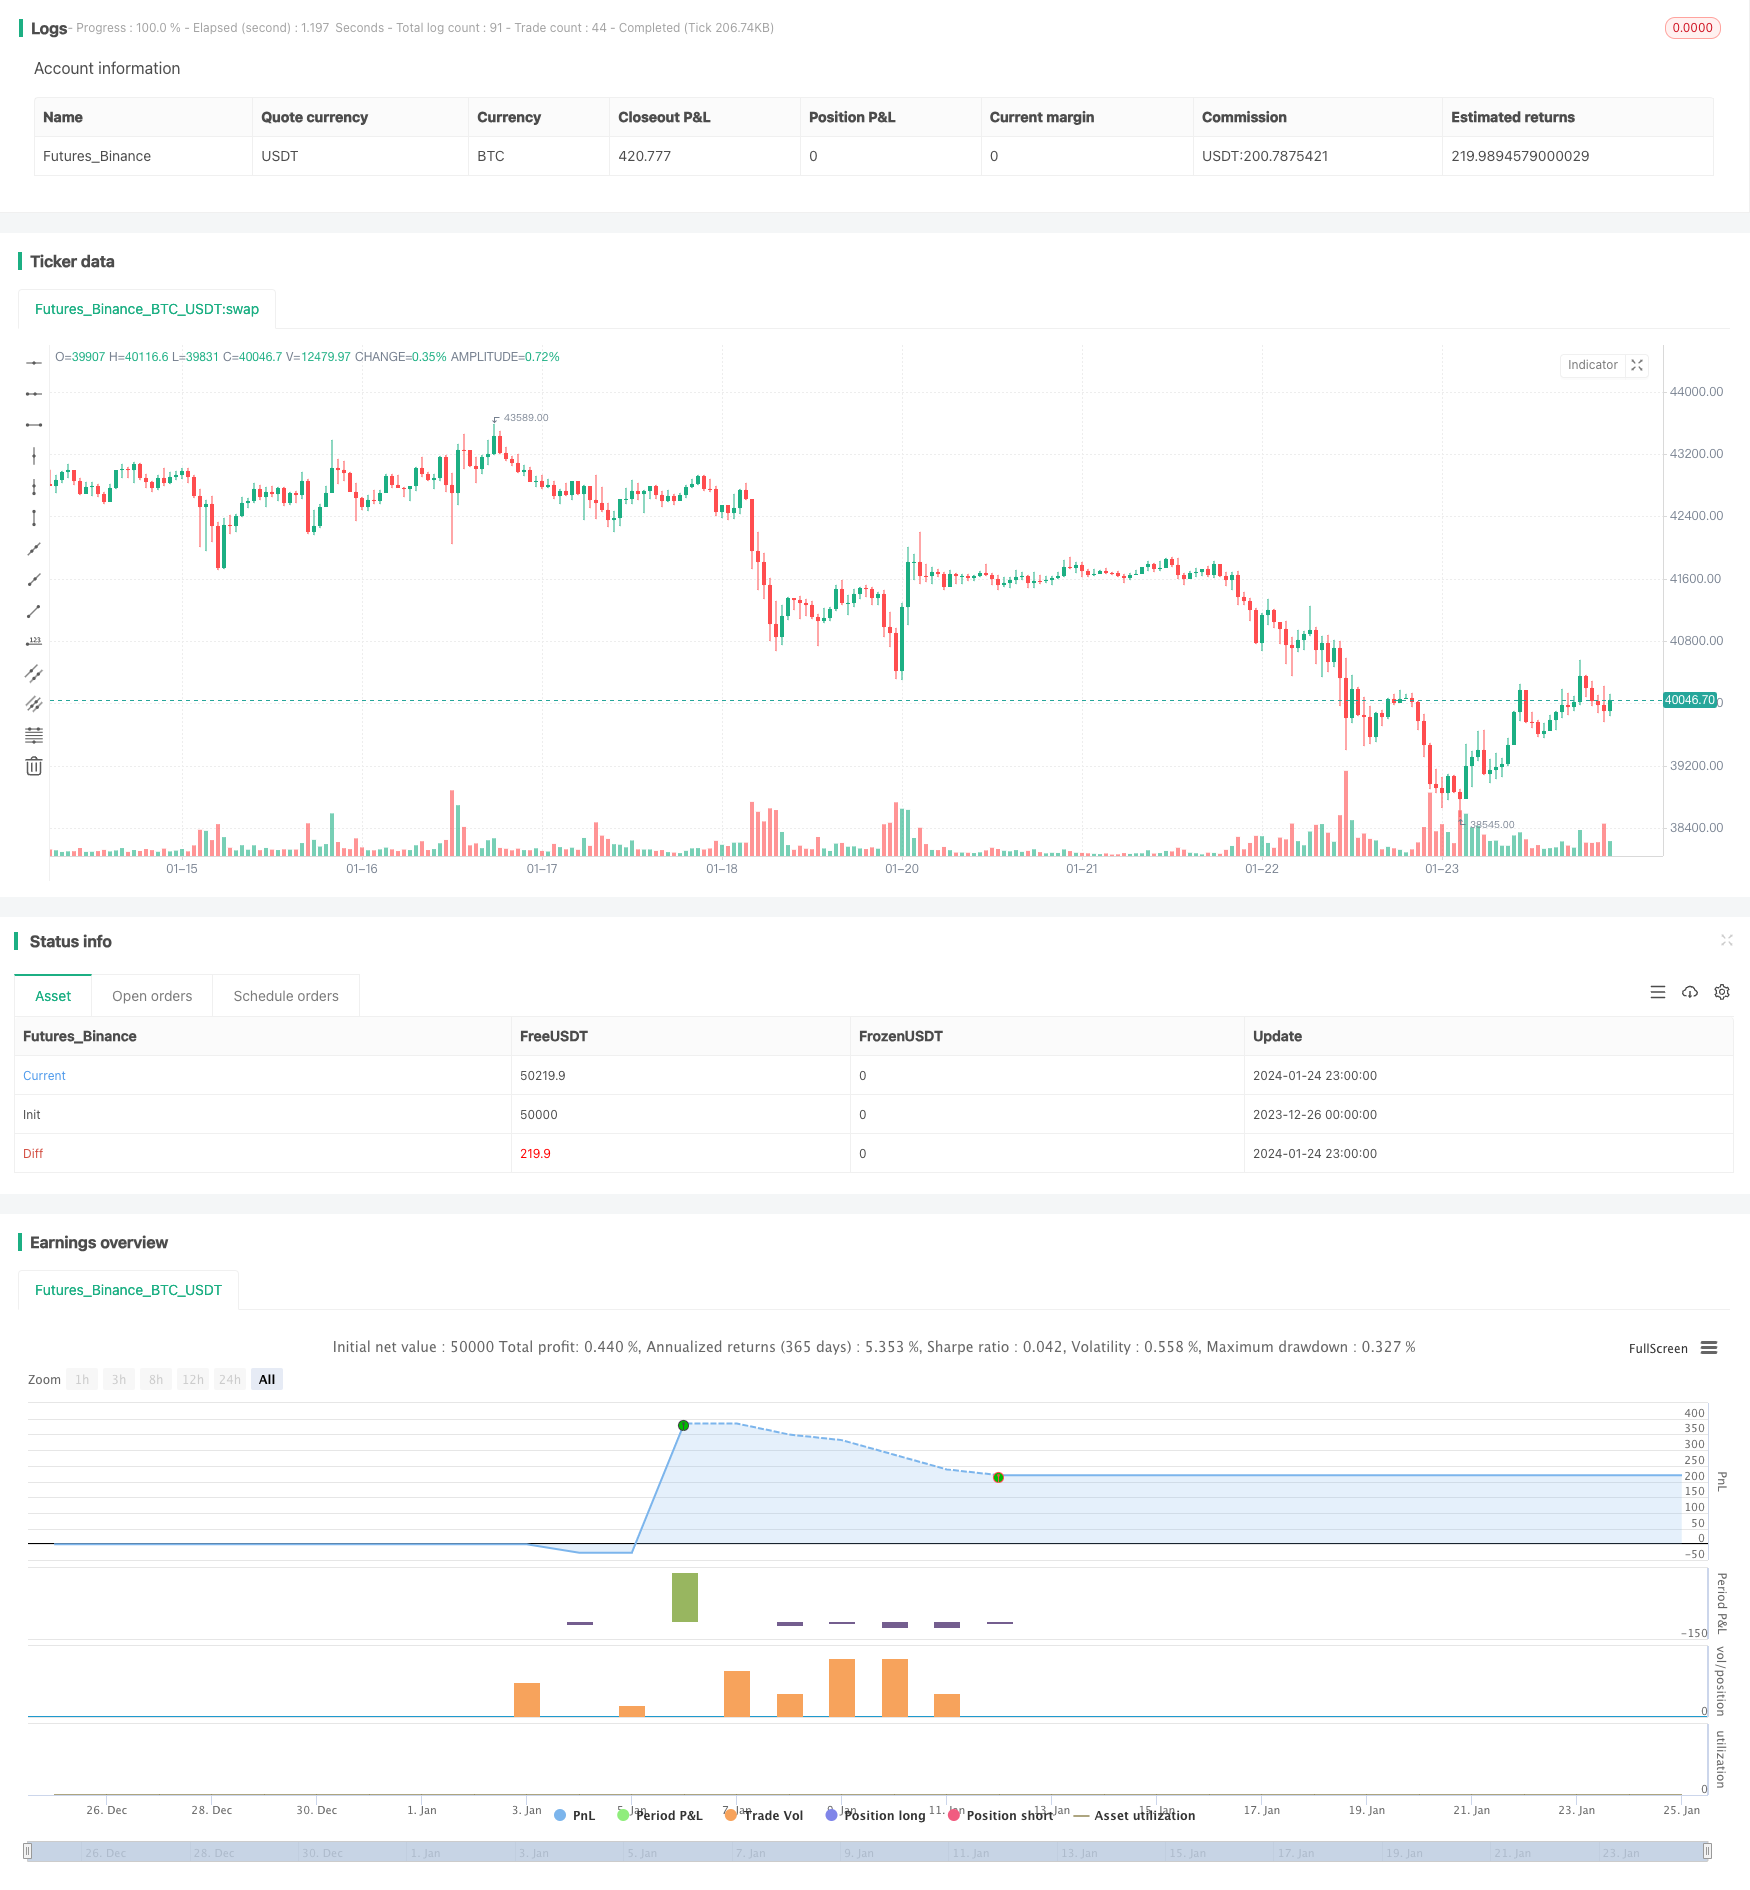
/*backtest
start: 2023-12-26 00:00:00
end: 2024-01-25 00:00:00
period: 1h
basePeriod: 15m
exchanges: [{"eid":"Futures_Binance","currency":"BTC_USDT"}]
*/

// This source code is subject to the terms of the Mozilla Public License 2.0 at https://mozilla.org/MPL/2.0/
// © Part Timer

//This script accepts from and to date parameter for backtesting.
//This script generates white arrow for each buying signal

//@version=4
strategy("AMRS_LongOnly_PartTimer", overlay = true)

//i_endTime = input(defval = timestamp("02 Jun 2021 15:30 +0000"), title = "End Time", type=input.time)

StartYear=input(defval = 2000, title ="Start Year", type=input.integer)
StartMonth=input(defval = 01, title ="Start Month", type=input.integer)
StartDate=input(defval = 01, title ="Start Date", type=input.integer)

endYear=input(defval = 2021, title ="End Year", type=input.integer)
endMonth=input(defval = 06, title ="End Month", type=input.integer)
endDate=input(defval = 03, title ="End Date", type=input.integer)

ema11=ema(close,11)
ema13=ema(close,13)
ema21=ema(close,21)

afterStartDate = true
//g=bar_index==1
//ath()=>
    //a=0.0
    //a:=g ? high : high>a[1] ? high:a[1]

//a = security(syminfo.tickerid, 'M', ath(),lookahead=barmerge.lookahead_on)

newHigh = (high > highest(high,504)[1])
//plot down arrows whenever it's a new high
plotshape(newHigh, style=shape.triangleup, location=location.abovebar, color=color.green, size=size.tiny)
b=highest(high,504)[1]
VarChk=((b-ema13)/b)*100
TrigLow = (low <= ema13) and (low >= ema21) and (VarChk <= 10)
plotshape(TrigLow, style=shape.triangleup, location=location.belowbar, color=color.white, size=size.tiny)
ExitPrice=(ema21 - (ema21*0.05))
DrawPrice=(b - (b*0.20))
stopprice=0.0
if (close <= ExitPrice)
    stopprice := ExitPrice
if (close <= DrawPrice)
    stopprice := DrawPrice

if (TrigLow and afterStartDate)
    strategy.entry("Long", strategy.long)

strategy.exit("exit","Long", stop=stopprice)
//beforeEndDate = (time < i_endTime)
beforeEndDate = (time >= timestamp(syminfo.timezone,endYear, endMonth, endDate, 0, 0))
if (beforeEndDate)
    strategy.close_all()