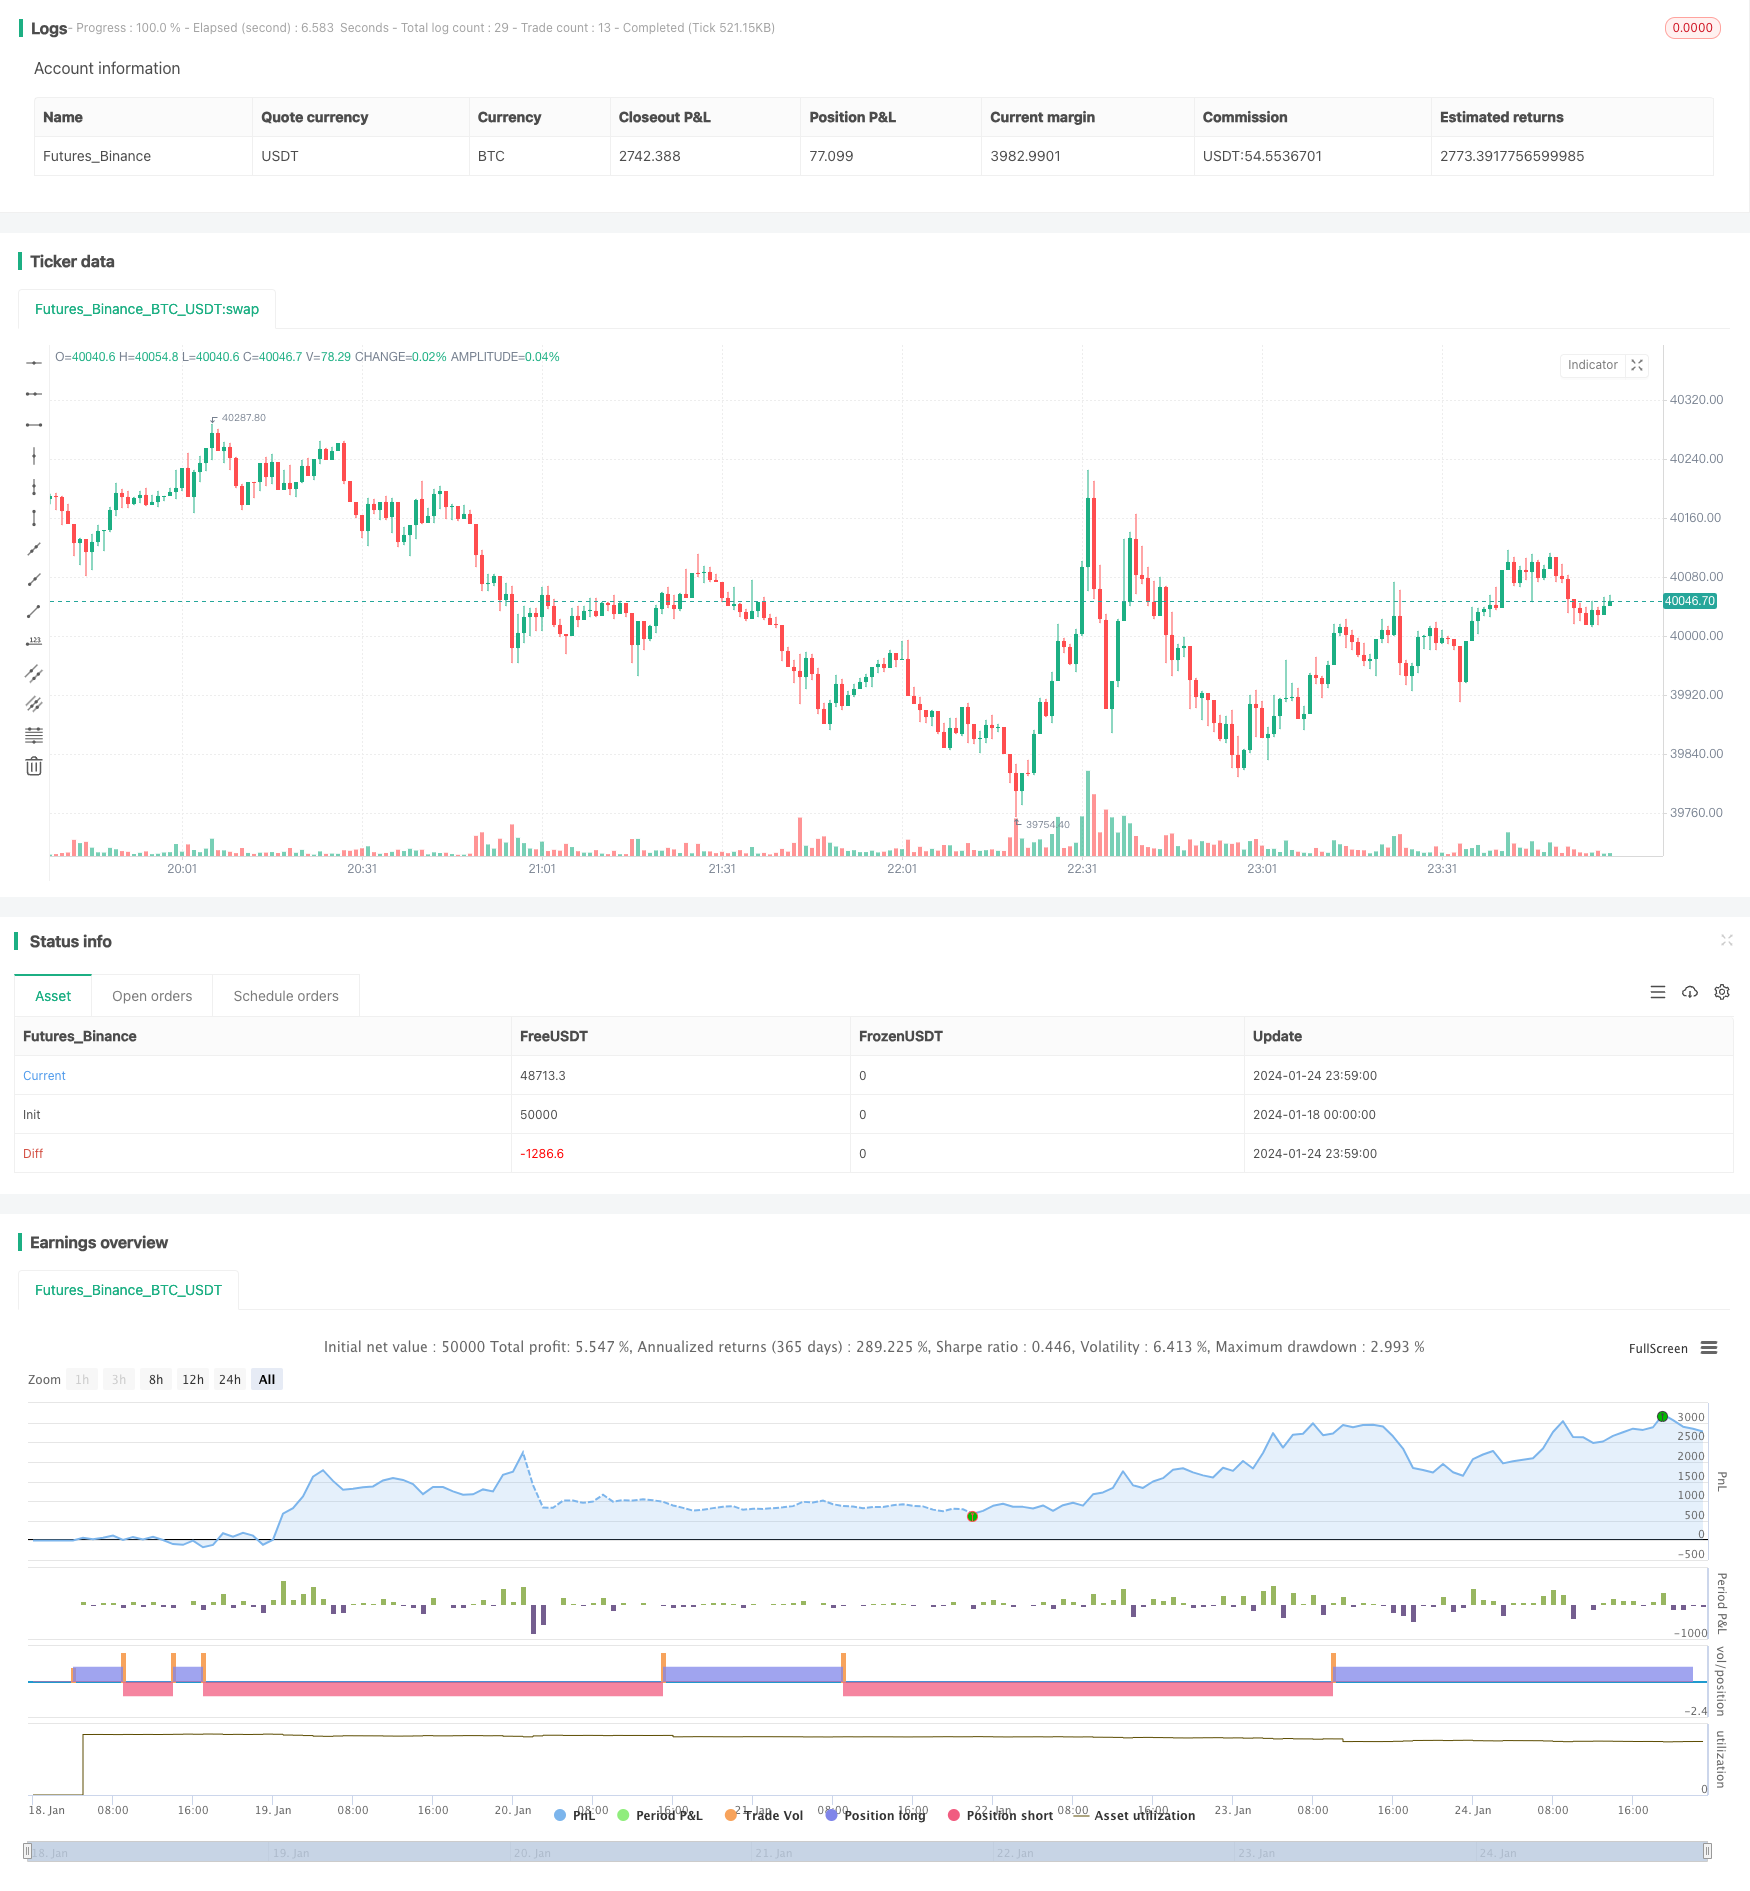
概述
该策略是基于平滑移动平均线与Stochastic指标的组合,目标是在趋势中捕获更多机会。它主要使用两条不同周期的指数移动平均线形成策略信号,结合Stochastic指标中的K线与D线的交叉作为入场时机选择,以期望在趋势中获得更高的盈利率。
策略原理
该策略使用12周期与26周期两条平滑移动平均线。当快线从下方上穿慢线时,做多;当快线从上方下穿慢线时,做空。为过滤假信号,它要求快线与慢线同向,快线在慢线之上才可做多,快线在慢线之下才可做空。
Stochastic指标中的K线与D线交叉作为入场时机选择。K线从超买线下方向上交叉D线时,做多;K线从超卖区下方向下交叉D线时,做空。
平滑移动平均线确定趋势方向,Stochastic指标过滤 Noise 并选择入场时机。它们的结合可以在趋势中获得更多获利机会。
策略优势
- 平滑移动平均策略本身就具有顺势而为特点,容易跟踪趋势
- 利用Stochastic指标过滤 Noise ,提高获利概率
- 快慢均线组合,当快线回调至慢线附近再入场,可获得更优博弈机会
- Stochastic指标中的K线与D线交叉组合使用,可进一步选择更佳入场点位
因此,该策略可顺势而为,有选择性地把握机会,从而获得更高的获利率。
风险分析
- 短期内离场风险较大。当快线回调至慢线时,可能会被否定信号或被套住
- 因其顺势而为的特性,行情剧烈反转时,无法快速适应,可能导致较大亏损
为降低这些风险,我们可以设置止损,或采用更宽松的移动平均线参数组合。
优化方向
该策略可从以下几个方面进行进一步优化:
- 测试不同移动平均线参数的组合,找到更佳的参数
- 测试不同Stochastic参数的组合
- 增加止损策略
- 增加基于波动率的动态止损
- 测试不同品种不同周期参数的组合优化
- 测试机器学习算法优化参数
通过测试不同的参数组合,可找到更强的参数;同时设立止损策略可有效降低风险,提高策略稳定性。
总结
该策略整合了平滑移动平均与Stochastic指标的优势,可顺势跟踪趋势,并选择更佳时机入场。它容易操作,风险可控,具有很大的实用价值。通过持续的测试与优化,其表现可得到进一步提升。它可为量化交易者提供一个高效稳定的趋势跟踪策略模型。
策略源码
/*backtest
start: 2024-01-18 00:00:00
end: 2024-01-25 00:00:00
period: 1m
basePeriod: 1m
exchanges: [{"eid":"Futures_Binance","currency":"BTC_USDT"}]
*/

//@version=4
// author SoftKill

strategy(title="Price EMA with stock", shorttitle="EMA STOCH", overlay=true)
src = input(title="Source", type=input.source, defval=close)

src_0 = src[0]
src_1 = src[1]
src_2 = src[2]
src_3 = src[3]
src_4 = src[4]

len50 = input(50, minval=1, title="Length")
src50 = input(close, title="Source")
out50 = ema(src50, len50)
len100 = input(100)
src100 = input(close, title="Source")
out100 = ema(src100, len100)

len1 = input(1, minval=1, title="Length")
src1 = input(close, title="Source")
out1 = sma(src1, len1)

length = input(5, minval=1)
OverBought = input(80)
OverSold = input(20)
smoothK = 3
smoothD = 3

k = sma(stoch(close, high, low, length), smoothK)
d = sma(k, smoothD)
cu = crossover(k,OverSold)
co = crossunder(k,OverBought)

sma_down = crossunder(out1, out50)
sma_up = crossover(out1,out50)

//if (not na(k) and not na(d))
  //  if (co and k < OverSold)
    //    strategy.entry("StochLE", strategy.long, comment="StochLE")
    //if (cu and k > OverBought)
     //   strategy.entry("StochSE", strategy.short, comment="StochSE")

crossCandle_4 = crossover(src[4],out50)
crossCandleUnder_4= cross(src[4],out50)
crossCandle_3 = crossover(src[3],out50)
crossCandleUnder_3= crossunder(src[3],out50)
crossCandle_2 = crossover(src[2],out50)
crossCandleUnder_2= crossunder(src[2],out50)
crossCandle_1 = crossover(src[1],out50)
crossCandleUnder_1= crossunder(src[1],out50)
crossCandle_0 = crossover(src[0],out50)
crossCandleUnder_0= crossunder(src[0],out50)

conditionOver = (crossCandle_4 or crossCandle_3 or crossCandle_2 or crossCandle_1 or crossCandle_0)
conditionUnder =(crossCandleUnder_4 or crossCandleUnder_3 or crossCandleUnder_2 or crossCandleUnder_1 or crossCandleUnder_0)

touch4 = (cross(low[4],out50) or cross(high[4],out50))
touch3 = (cross(low[3],out50) or cross(high[3],out50))
touch2 = (cross(low[2],out50) or cross(high[2],out50))
touch1 = (cross(low[1],out50) or cross(high[1],out50))

touch = touch1 or touch2 or touch3 or touch4

//and sma_up
//and sma_down

// Getting inputs
fast_length = input(title="Fast Length", type=input.integer, defval=12)
slow_length = input(title="Slow Length", type=input.integer, defval=26)
src_macd = input(title="Source", type=input.source, defval=close)
signal_length = input(title="Signal Smoothing", type=input.integer, minval = 1, maxval = 50, defval = 9)
sma_source = input(title="Simple MA(Oscillator)", type=input.bool, defval=false)
sma_signal = input(title="Simple MA(Signal Line)", type=input.bool, defval=false)

// Plot colors
col_grow_above = #26A69A
col_grow_below = #FFCDD2
col_fall_above = #B2DFDB
col_fall_below = #EF5350
col_macd = #0094ff
col_signal = #ff6a00

// Calculating
fast_ma = sma_source ? sma(src_macd, fast_length) : ema(src_macd, fast_length)
slow_ma = sma_source ? sma(src_macd, slow_length) : ema(src_macd, slow_length)
macd = fast_ma - slow_ma
signal = sma_signal ? sma(macd, signal_length) : ema(macd, signal_length)
hist = macd - signal

//plot(hist, title="Histogram", style=plot.style_columns, color=(hist>=0 ? (hist[1] < hist ? col_grow_above : col_fall_above) : (hist[1] < hist ? col_grow_below : col_fall_below) ), transp=0 )
//plot(macd, title="MACD", color=col_macd, transp=0)
//plot(signal, title="Signal", color=col_signal, transp=0)


// plot((conditionOver or conditionUnder or touch)  and src[0] >= out50 and close >= out50 and  (cu) and out50 > out100 and hist>=0 , title="Buy", style=plot.style_columns, color=color.lime)
// plot((conditionOver or conditionUnder or touch)  and src[0] <= out50 and close <= out50 and  (co) and out50< out100 and hist<=0 , title="sell", style=plot.style_columns, color=color.red)


long_cond = ((conditionOver or conditionUnder or touch)  and src[0] >= out50 and close > out50 and  (cu) and out50 > out100 and hist>=0)
short_cond = ((conditionOver or conditionUnder or touch)  and src[0] <= out50 and close < out50 and  (co) and out50< out100 and hist<=0)

tp=input(0.1)
sl=input(0.1)

strategy.entry("long",strategy.long, when=long_cond)
strategy.entry("short",strategy.short, when=short_cond)

strategy.exit("X_long", "long", profit=close * tp / syminfo.mintick,  loss=close * sl / syminfo.mintick, when=touch  )
strategy.exit("x_short", "short",profit=close * tp / syminfo.mintick,loss=close * sl / syminfo.mintick,when = touch )

// //tp = input(0.0003, title="tp")
// tp = 0.0003
// //sl = input(1.0 , title="sl")
// sl = 1.0
// strategy.exit("closelong", "long" , profit = close * tp / syminfo.mintick, loss = close * sl / syminfo.mintick, alert_message = "closelong")
// strategy.exit("closeshort", "short" , profit = close * tp / syminfo.mintick, loss = close * sl / syminfo.mintick, alert_message = "closeshort")