概述
三重SMA策略是一种基于三条不同周期的简单移动平均线进行趋势判断和entries的策略。它可以自动追踪趋势,利用趋势中的回调进行加仓建仓。
策略原理
该策略使用三条不同周期的SMA作为主要的趋势判断指标,包括200周期、400周期和600周期的SMA。价格在三条SMA之上时判断为上涨趋势,反之则为空头趋势。
作为entries指标,策略结合使用close价格和StochClose振荡器。只有当价格与三重SMA的方向一致时才会发出信号。StochClose指标用于判断是否过量或超卖,当StochClose上穿95时做多,下穿5时做空。
止损标准为当价格触及最慢的SMA时止损。
策略可以进行加仓,最大加仓次数为10次。并设置了三个不同比例的止盈,分别为1%、2%和6%。
优势分析
三重SMA策略最大的优势在于,通过组合使用三条不同周期的SMA,能较好地判断趋势的方向和力度。比单一SMA具有更强的过滤假信号的能力。
另外,结合StochClose指标判断是否超买超卖,可以避免在趋势反转点附近进场,从而减少错误的entries。
止损标准简单直接,将最慢周期的SMA作为止损线,可以最大限度避免止损过早。
允许加仓也使得策略可以持续追踪趋势获利。
风险分析
该策略主要的风险在于,三条SMA未必能完全过滤掉所有假信号,价格突破后如果不能形成趋势再次回调,则可能造成损失。这种情况通常发生在重要支撑阻力附近。
此外,StochClose指标本身也会产生错误信号,导致不适当的entries。这种情况通常会在价格震荡区间发生。
为降低这些风险,可以适当调整SMA的周期;或者增加其他指标进行组合判断,如KDJ、MACD等,确保进入的信号质量。
优化方向
该策略可以从以下几个方面进行优化:
增加或调整SMA的周期数,找到更适合具体品种的周期参数
增加其他指标进行组合判断,如KDJ、MACD等,提高entries质量
优化止盈止损标准,使其更加贴合市场的波动范围
优化加仓的次数和比例,找到更适合的加仓策略
测试不同的品种参数,使策略参数全面适应更多品种
总结
三重SMA策略整体而言是一个非常实用的趋势跟踪策略。它通过组合应用三条不同周期的SMA以及StochClose指标,实现了较好的趋势判断效果,能有效避免错误信号。同时允许适当加仓,从而能始终跟踪趋势参与profit。通过参数调整和优化,该策略可以成为一个强劲的趋势跟踪机器。
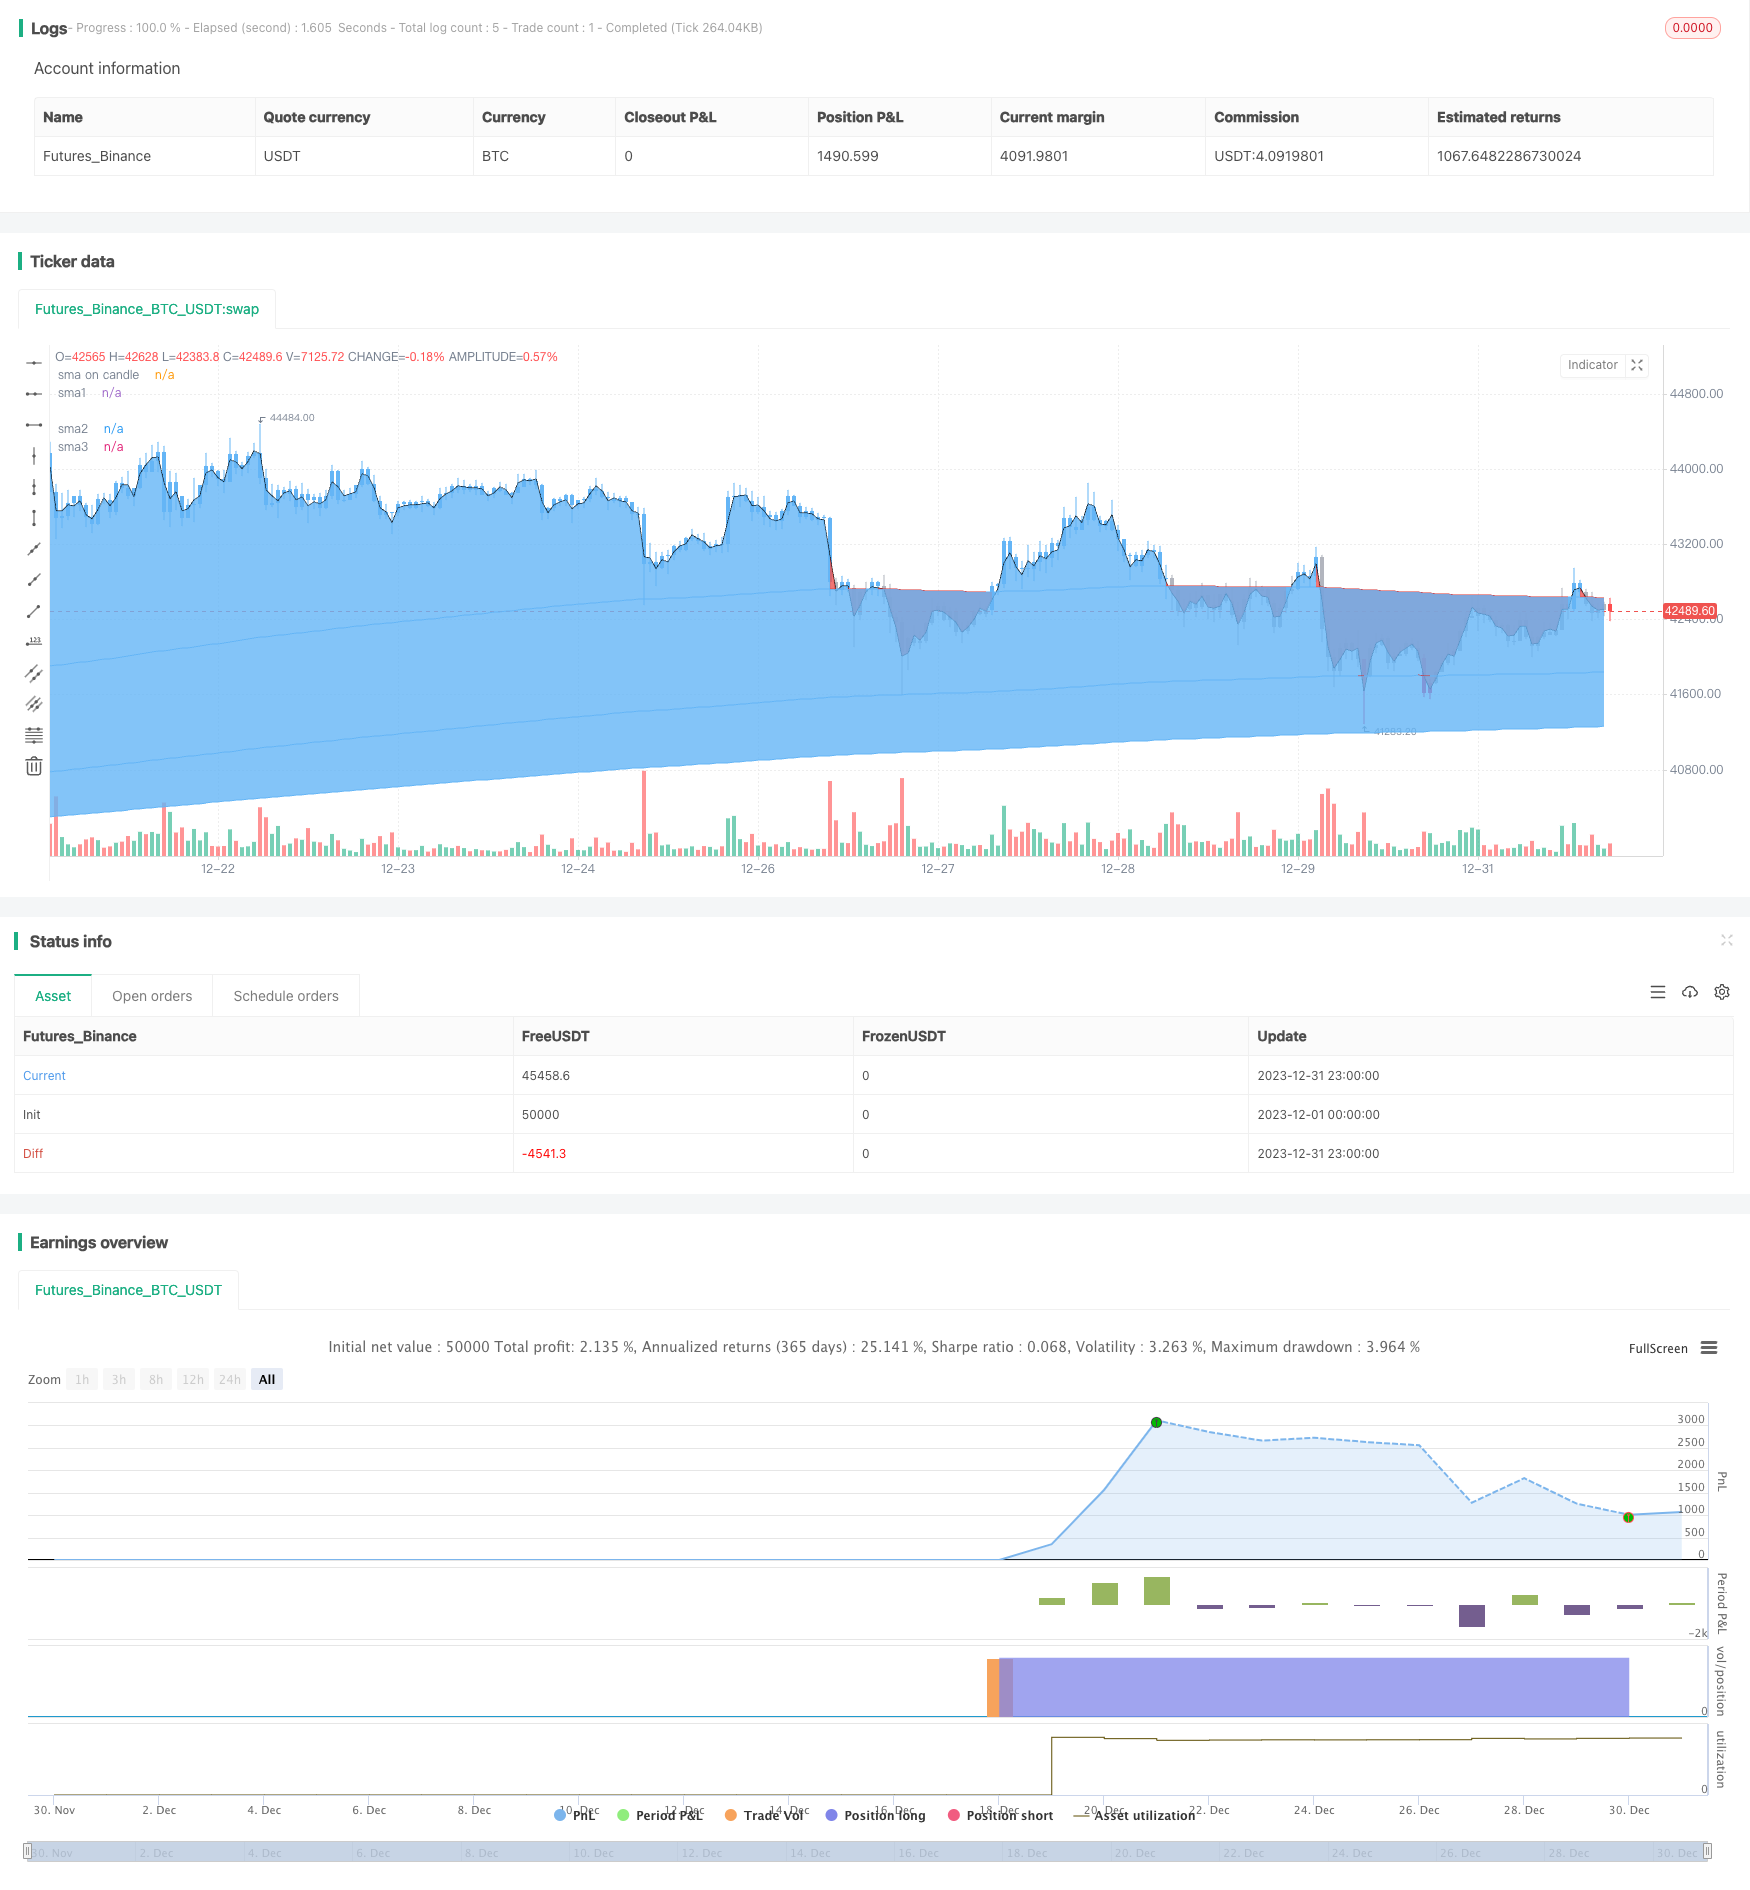
/*backtest
start: 2023-12-01 00:00:00
end: 2023-12-31 23:59:59
period: 1h
basePeriod: 15m
exchanges: [{"eid":"Futures_Binance","currency":"BTC_USDT"}]
*/

//@version=4
strategy(title="Tripla Sma with entries based on sma price closes ", shorttitle="TRIPLE SMA STRATEGY", overlay=true) ////resolution=""
len = input(200, minval=1, title="sma 1 length")
len1 = input(400, minval=1, title="sma 2 length")
len2 = input(600, minval=1, title="sma 3 length")
src = input(close, title="Source")
////////////////////////////////////////////
smma = 0.0
smma := na(smma[1]) ? sma(src, len) : (smma[1] * (len - 1) + src) / len

up = smma > smma [1]
down =smma < smma[1]
mycolor = up ? #64b5f6 : down ? #d32f2f : na
fastma = sma(hl2, 1)

fastplot = plot(fastma, color=#000000, transp=100, title='sma on candle')
slowplot = plot(smma, color=mycolor, transp=55, title='sma1')

////////////////////////////////////////////
smma1 = 0.0
smma1 := na(smma1[1]) ? sma(src, len1) : (smma1[1] * (len1 - 1) + src) / len1

up2 = smma1 > smma1 [1]
down2 =smma1 < smma1[1]

mycolor2 = up2 ? #64b5f6 : down2 ? #d32f2f : na
slowplot2 = plot(smma1, color=mycolor2, transp=45, title='sma2')

////////////////////////////////////////////
smma2 = 0.0
smma2 := na(smma2[1]) ? sma(src, len2) : (smma2[1] * (len2 - 1) + src) / len2

up3 = smma2 > smma2 [1]
down3 =smma2 < smma2[1]

mycolor3 = up3 ? #64b5f6 : down3 ? #d32f2f : na
slowplot3 = plot(smma2, color=mycolor3, transp=35, title='sma3')

////////////////////////////////////////////////////////////////////////////////////////
//Fill gaps
fillData = smma > fastma
fillData2 = smma < fastma

fillDtat = smma1 > smma
fillDtat2 = smma1 < smma

fillDat = smma2 > smma1
fillDat2 = smma2 < smma1


fillCol1 = fillData ? #ef5350 : fillData2 ? #64b5f6 : na
fillCol2 = fillDtat ? #ef5350 : fillDtat2 ? #64b5f6 : na
fillCol3 = fillDat ? #ef5350 : fillDat2 ? #64b5f6 : na


fill(slowplot, fastplot, color=fillCol1, transp=90, title="sma1 fill")
fill(slowplot, slowplot2, color=fillCol2, transp=80, title="sma2 fill")
fill(slowplot2, slowplot3, color=fillCol3, transp=60, title="sma3 fill")

uc = (close > smma) and (close > smma1)
dc = (close < smma) and (close < smma1)

barColor = uc ? #64b5f6 : dc ? #e91e63 : #b2b5be
barcolor(color=barColor)
////////////////////////////////////////////////////////////////////////////////////////////////////////////////////////////////////////////////////////////////////////////////
//StochClose from @trendinvestpro
periods = input(50, minval=1, title="length for the oscillator")
smooth = input(5, minval=1, title="oscillator smoothing")
hhc=highest(close,periods)
llc=lowest(close,periods)
StochClose = sma((close-llc)/(hhc-llc)*100, smooth)

shortline = input(95, minval=0, title="signal when oscillator crosses above")
longline = input(5, minval=0, title="signal when oscillator crosses below")

////////////////////////////////////////////////////////////////////////////////////////////////////////////////////////////////////////////////////////////////////////////////
longs = close > smma2
shorts = close < smma2


long = longs == true and crossunder(StochClose, longline)
short = shorts == true and crossover(StochClose, shortline)

stoplong = close < smma and close < smma1 and close < smma2
stopshort = close > smma and close > smma1 and close > smma2

p1 = strategy.position_avg_price / 100 / syminfo.mintick

maxx = input(2500, title="max orders filled on a day", minval=0)
takeprofit1 = input(1, title="take profit level 1", minval=0)
takeprofit2 = input(2, title="take profit level 2", minval=0)
takeprofit3 = input(6, title="take profit level 3", minval=0)

takeprofitqt1 = input(30, title="take profit quantity first", minval=0)
takeprofitqt2 = input(30, title="take profit quantity second", minval=0)
takeprofitqt3 = input(30, title="take profit quantity third", minval=0)
//////////////////////////////////////////////////////////////////////////////////////////////////////////////////////////////////////////////////////////////////////////////////
/////////////////////////////////////////////////////////////////////////////////////////Strategy entries/////////////////////////////////////////////////////////////////////////////////////////
// strategy.risk.max_intraday_filled_orders(maxx)
strategy.entry("long", strategy.long, when=long)
strategy.exit("tpl1", "long", qty_percent = takeprofitqt1, profit = takeprofit1 * p1)
strategy.exit("tpl2", "long", qty_percent = takeprofitqt2, profit = takeprofit2 * p1)
strategy.exit("tpl3", "long", qty_percent = takeprofitqt3, profit = takeprofit3 * p1)
strategy.close("long", when=stoplong == true)


strategy.entry("short", strategy.short, when=short)
strategy.exit("tpl1", "short", qty_percent = takeprofitqt1, profit = takeprofit1 * p1)
strategy.exit("tpl2", "short", qty_percent = takeprofitqt2, profit = takeprofit2 * p1)
strategy.exit("tpl3", "short", qty_percent = takeprofitqt3, profit = takeprofit3 * p1)
strategy.close("short", when=stopshort == true)