Moving Average Difference Zero Cross Strategy

Author: ChaoZhang, Date: 2024-01-26 15:45:03
Tags:

img

Overview

This strategy uses the moving average difference method combined with zero axis crossover to determine buy and sell signals. The basic idea is that when the price approaches the moving average line from above, it is considered as bearish signal, and when the price approaches the moving average line from below, it is considered as bullish signal.

Strategy Principle

  1. Calculate the 8-period exponential moving average ema and the lowest moving average over the past 8 days lowestEMA
  2. Calculate the difference diff between the price and the current moving average ema
  3. When diff is less than 0, it is a bearish signal. When diff crosses above 0, it is a bottom divergence signal, indicating bullish.
  4. Combine the numerical value of diff to compare the maximum decline over the past week to generate trading signals

Advantage Analysis

  1. Using the dual moving average system can effectively filter false breakthroughs
  2. Applying the minimum price theory to discover bottom signals
  3. Numerical comparison to judge oversold and overbought conditions, avoiding chasing highs and killing lows

Risk Analysis

  1. Dual moving average strategies are prone to whipsaw effects
  2. Need to pay attention to the problem of excessive trading frequency
  3. Reasonable setting of moving average parameters is critical

Optimization Directions

  1. Adjust the moving average period parameters to adapt to different cycles
  2. Increase volume indicators to filter false breakthrough signals
  3. Combine the stochastic indicator to avoid oversold and overbought conditions

Summary

This strategy integrates the moving average difference method and zero axis crossover system to improve the accuracy of buy and sell point detection. However, further optimization of parameter settings and combination with other indicators to filter signals are still needed. In general, this simple indicator strategy has considerable efficacy and can be used as a basic strategy for live trading.


/*backtest
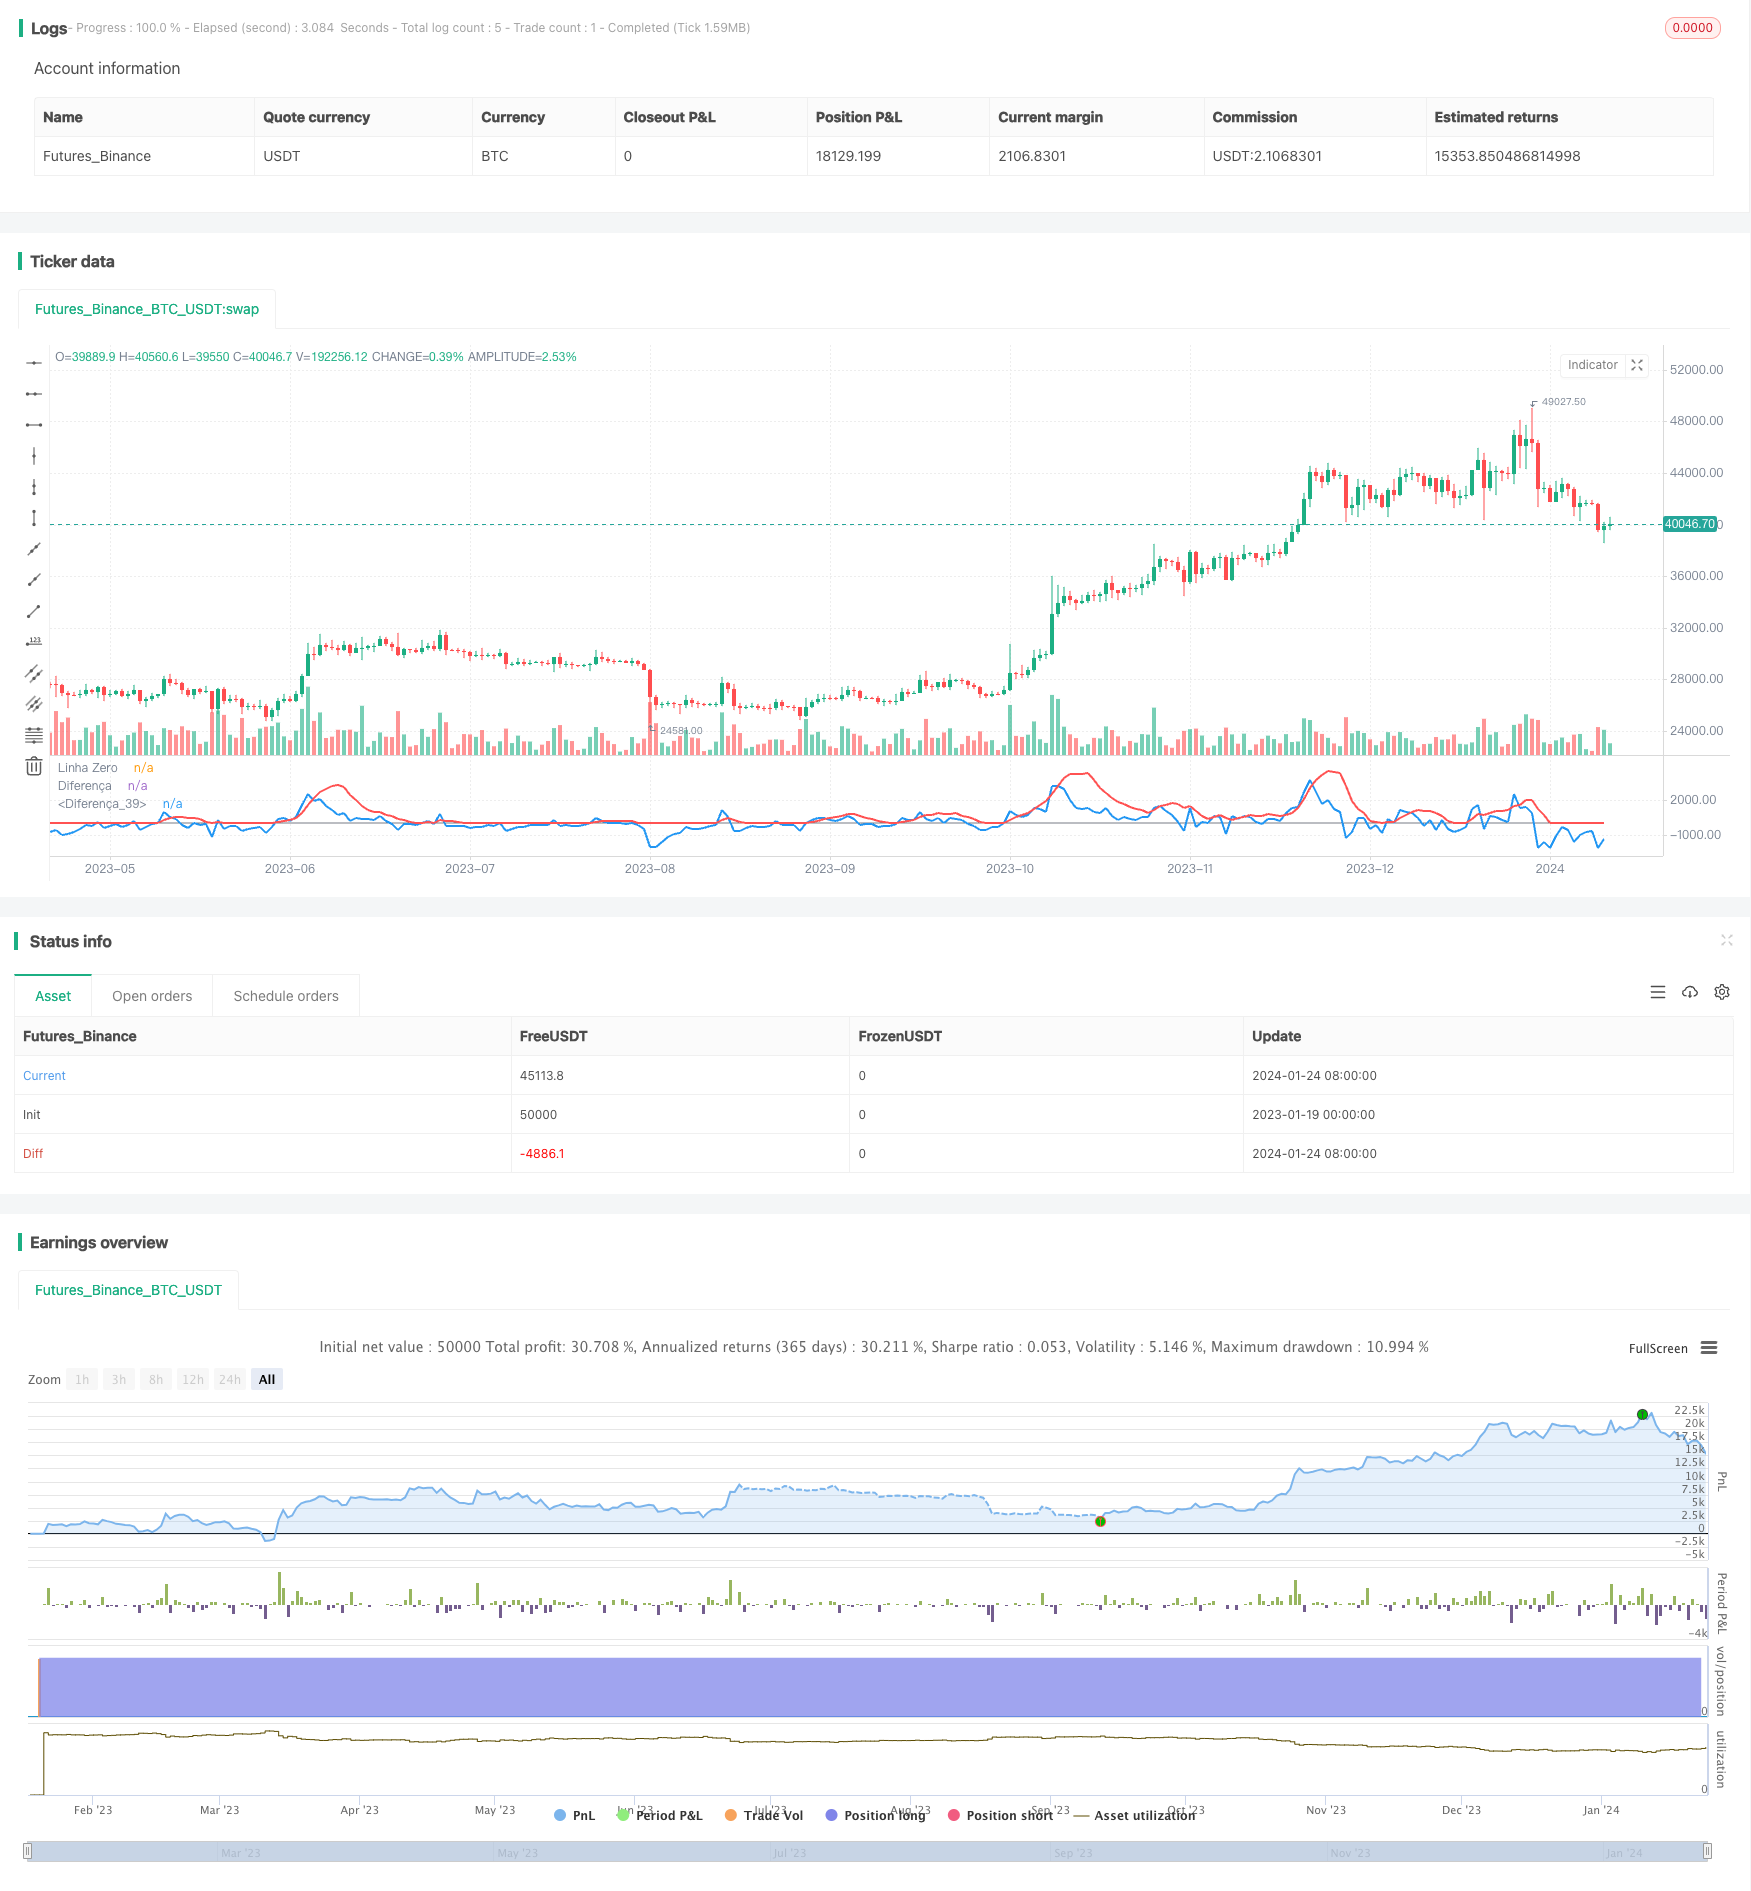
start: 2023-01-19 00:00:00
end: 2024-01-25 00:00:00
period: 1d
basePeriod: 1h
exchanges: [{"eid":"Futures_Binance","currency":"BTC_USDT"}]
*/

//@version=4
strategy(title = "Estratégia diferença menor preço de 8")

// Configuração da Média Móvel
emaPeriod = 8

ema= ema(close, emaPeriod)
ema1= ema(close[1], emaPeriod)
lowestEMA = lowest(ema, 8)

// Calcula a diferença entre o preço e a média móvel
diff = close - ema
diff1 = close[1] - ema1
diffLow = ema - lowestEMA

//Condições
diffZero = diff < 0
diffUnder = diff < diffLow
diffUm = diff > 0
Low0 = diffLow == 0


// Sinais de entrada
buy_signal = diffUnder and crossover(diff, diff1) 
sell_signal = diffUm and diffUnder and crossunder(diff, diff1)

// Executa as operações de compra/venda
if buy_signal
    strategy.entry("Buy", strategy.long)
if sell_signal
    strategy.exit("Buy")

// Plota as linhas
plot(0, title="Linha Zero", color=color.gray)
plot(diff, title="Diferença", color=color.blue, linewidth=2)

plot(diffLow, title="Diferença", color=color.red, linewidth=2)


More