概述
自适应线性回归通道策略是一种基于线性回归分析的量化交易策略。该策略通过计算一定时间段内的证券价格线性回归方程,形成上下通道,并以通道上下轨作为交易信号,进行区间交易或趋势跟踪。
策略原理
自适应线性回归通道策略的核心是计算一定数量K根K线的收盘价线性回归方程,形成代表价格中位数的中线、代表价格上限的上轨和代表价格下限的下轨。具体计算过程如下:
收集输入参数length指定的K根K线的independent variable x和dependent variable y。这里x为1到length的整数,y为对应K线的收盘价。
计算回归系数:
- b = (∑y)/n - m(∑x)/n
- m = [(n∑xy) - (∑x)(∑y)]/[(n∑x2) - (∑x)2]
- b = (∑y)/n - m(∑x)/n
计算每个K线对应线性回归值y’,标准差STDDEV
中线为回归方程y’=mx+b,上下轨分别为中线上下浮动一个标准差倍数区间。
随着新K线到达,以上计算滚动更新,形成上中下自适应通道。根据通道上下轨交叉做多做空,中线附近止损。
优势分析
自适应线性回归通道策略相比传统均线策略,具有如下优势:
更科学合理,回归分析模型比均线有更高的统计学意义
更自适应灵活,通道范围会随价格变化自动调整
回测效果更佳,在某些品种上明显优于均线策略
实盘验证效果好,在实盘中表现令人满意
风险分析
该策略主要存在以下风险:
价格震荡过大导致巨大亏损。解决方法是设置止损,优化参数。
通道错落带来追踪效果不佳。解决方法是调整参数,结合其他技术指标。
回测效果看似很好,但实盘效果差强人意。解决方法是调整参数,充分验证。
优化方向
该策略可以从以下几个维度继续优化:
测试更多参数组合,寻找最优参数
结合其他技术指标避免走势剧烈的时候信号错乱
增加止损策略控制亏损风险,保护资金
增加仓位管理模块,根据市场情况调整仓位规模
总结
自适应线性回归通道策略整体来说是一种效果还不错的量化策略。它理论基础稳固,实践效果良好,值得进一步研究和优化,可以成为量化交易体系中的有效组成部分。但也需要认识到其局限性,防范风险,谨慎实践。
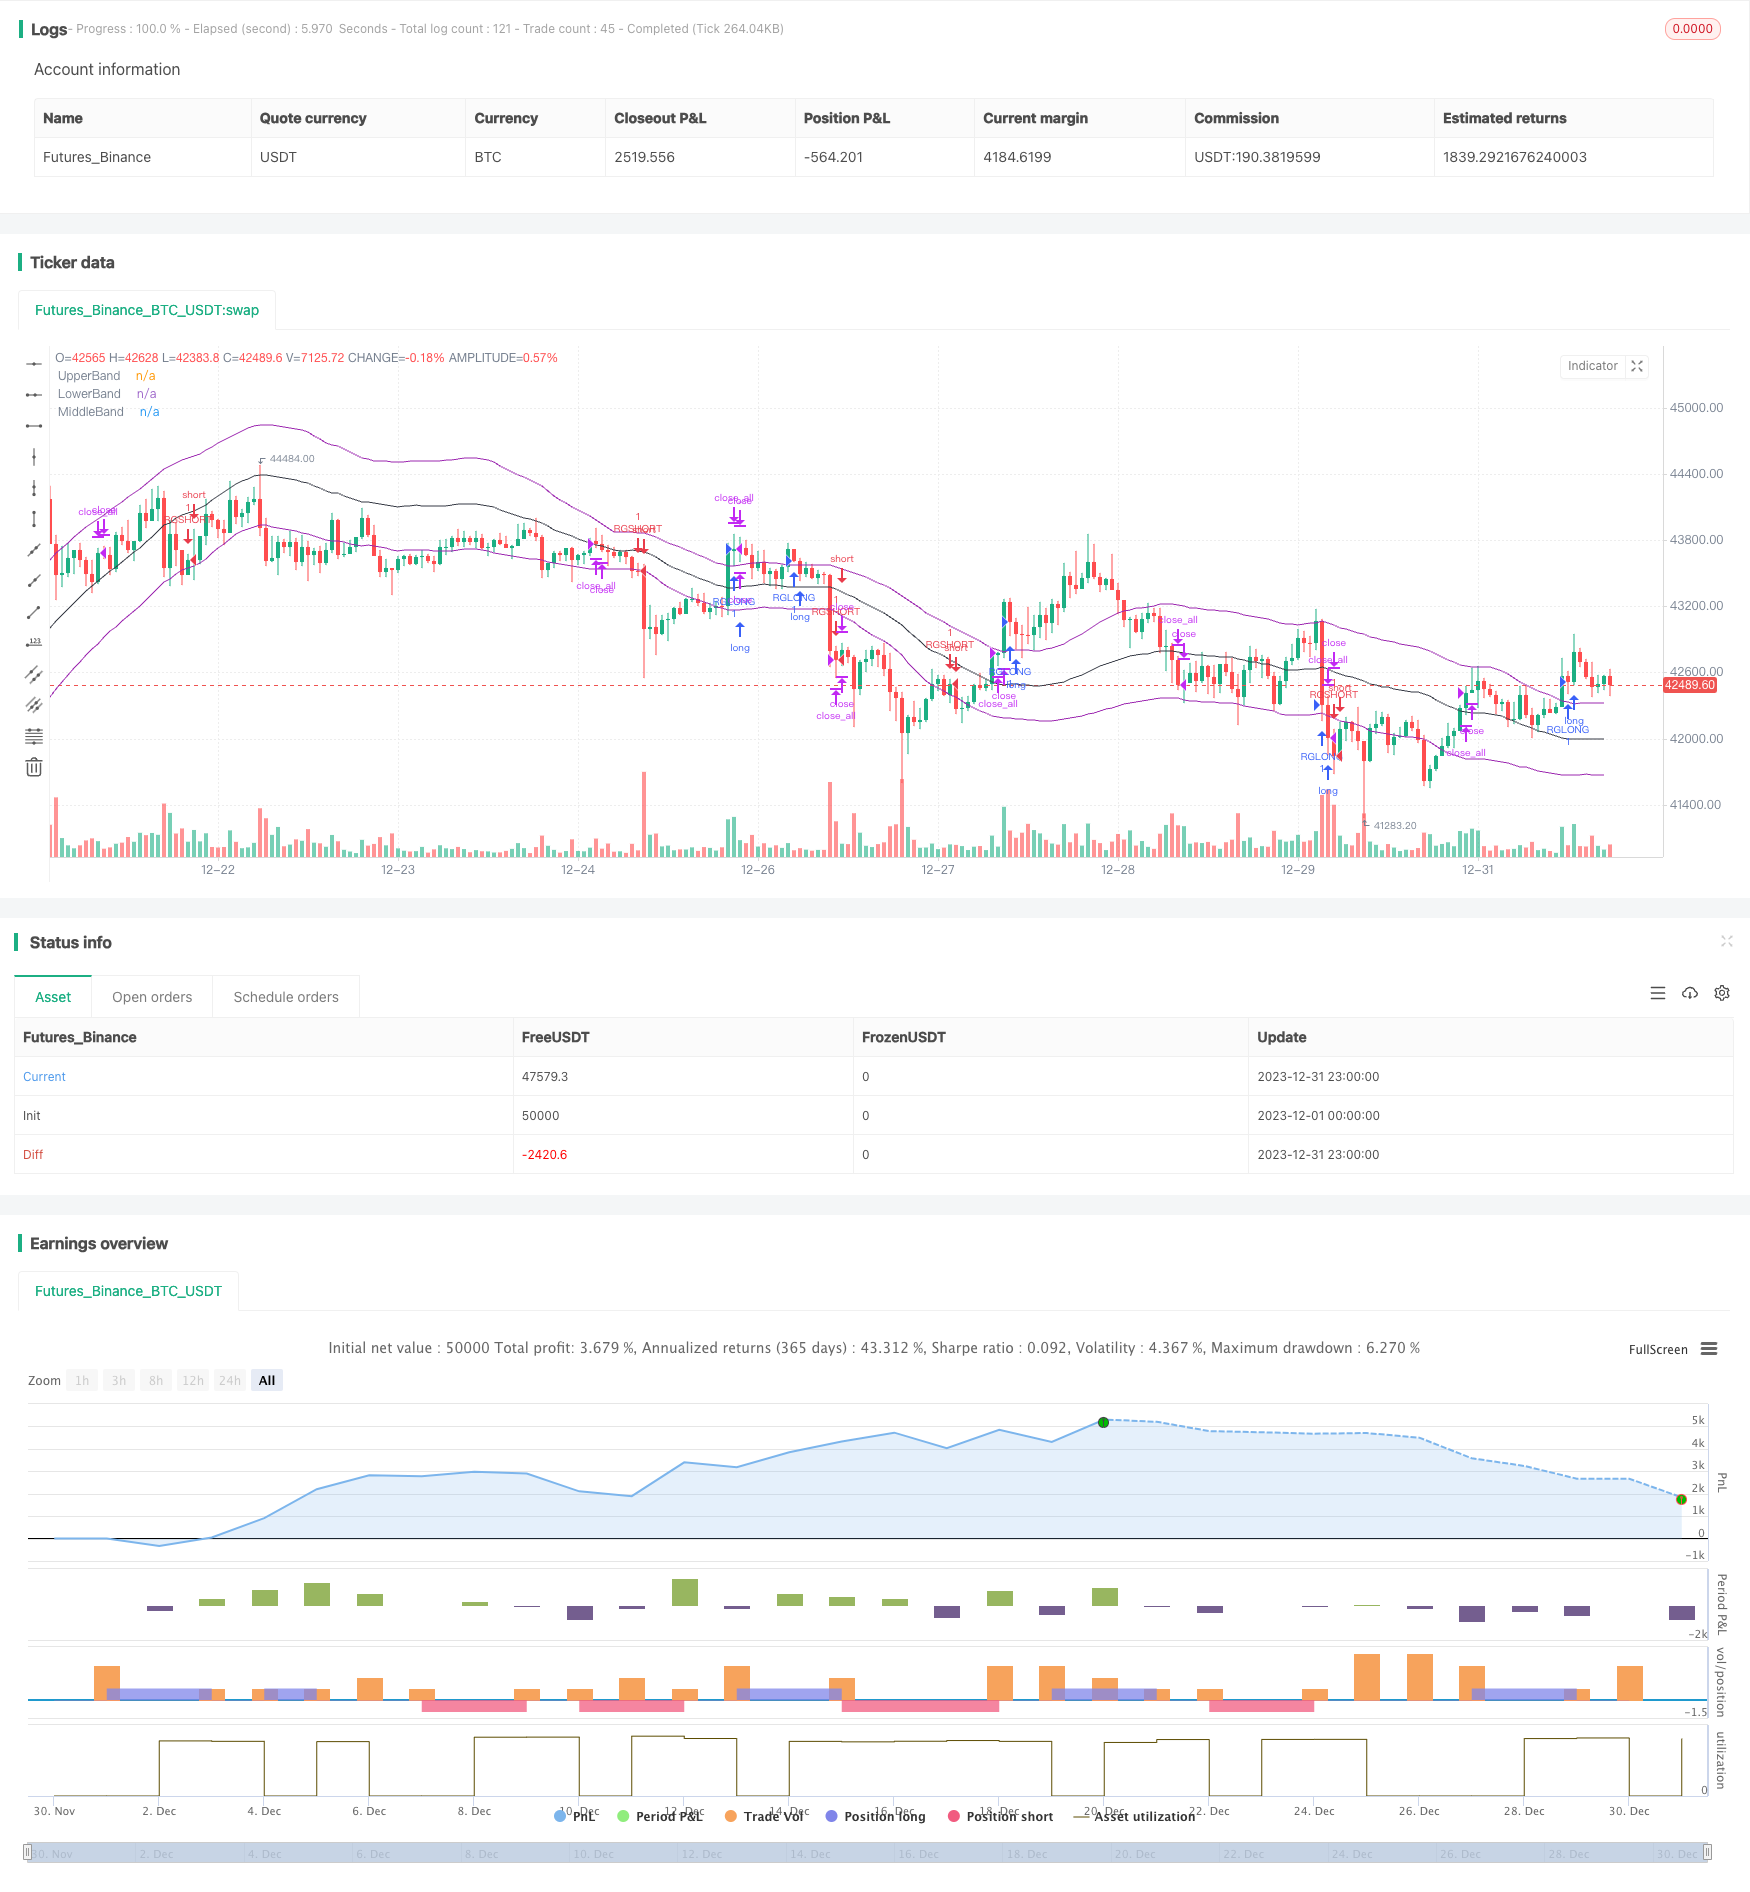
/*backtest
start: 2023-12-01 00:00:00
end: 2023-12-31 23:59:59
period: 1h
basePeriod: 15m
exchanges: [{"eid":"Futures_Binance","currency":"BTC_USDT"}]
*/

//@version=2
strategy("Stealthy 7 Linear Regression Channel Strategy", overlay=true)
source = open
length = input(100, minval=1)
mult1 = input(1, minval=0.001, maxval=50)
mult2 = input(1, minval=0.001, maxval=50)
DayTrader = input(title="Range Mode", type=bool, defval=false)

//Making the first least squares line
sum_x = length * (length + 1) / 2
sum_y = 0
sum_xy = 0
xyproductsum = 0
sum_xx = 0
for i = 1 to length
    sum_y := sum_y + close[i]
    sum_xy := i * close[i] + sum_xy
    sum_xx := i * i + sum_xx
m = (length*sum_xy - (sum_x * sum_y)) / (length * sum_xx - (sum_x * sum_x))
b = sum_y / length - (m * sum_x / length)

//Finding the first standard deviation from the line
difference = 0
for i = 1 to length
    y = i * m  + b
    difference := pow(abs(close[i] - y),2) + difference
STDDEV = sqrt(difference / length)

//Creating trading zones
dev = mult1 * STDDEV
dev2 = mult2 * STDDEV
upper = b + dev
lower = b - dev2
middle = b

if DayTrader == false
    if crossover(source, upper)
        strategy.entry("RGLONG", strategy.long, oca_name="RegChannel",  comment="RegLong")
    else
        strategy.cancel(id="RGLONG")

    if crossunder(source, lower)
        strategy.entry("RGSHORT", strategy.short, oca_name="RegChannel",  comment="RegShort")
    else
        strategy.cancel(id="RGSHORT")

    if crossover(source, middle) and strategy.position_size < 0
        strategy.close_all()
    if crossunder(source,middle) and strategy.position_size > 0
        strategy.close_all()

if DayTrader == true
    if crossover(source, lower)
        strategy.entry("RGLONG", strategy.long, oca_name="RegChannel",  comment="RegLong")
    else
        strategy.cancel(id="RGLONG")

    if crossunder(source, upper)
        strategy.entry("RGSHORT", strategy.short, oca_name="RegChannel",  comment="RegShort")
    else
        strategy.cancel(id="RGSHORT")


plot(upper, title="UpperBand", color=purple, linewidth=1, style=line)
plot(lower, title="LowerBand", color=purple, linewidth=1, style=line)
plot(middle, title="MiddleBand", color=black, linewidth=1, style=line)