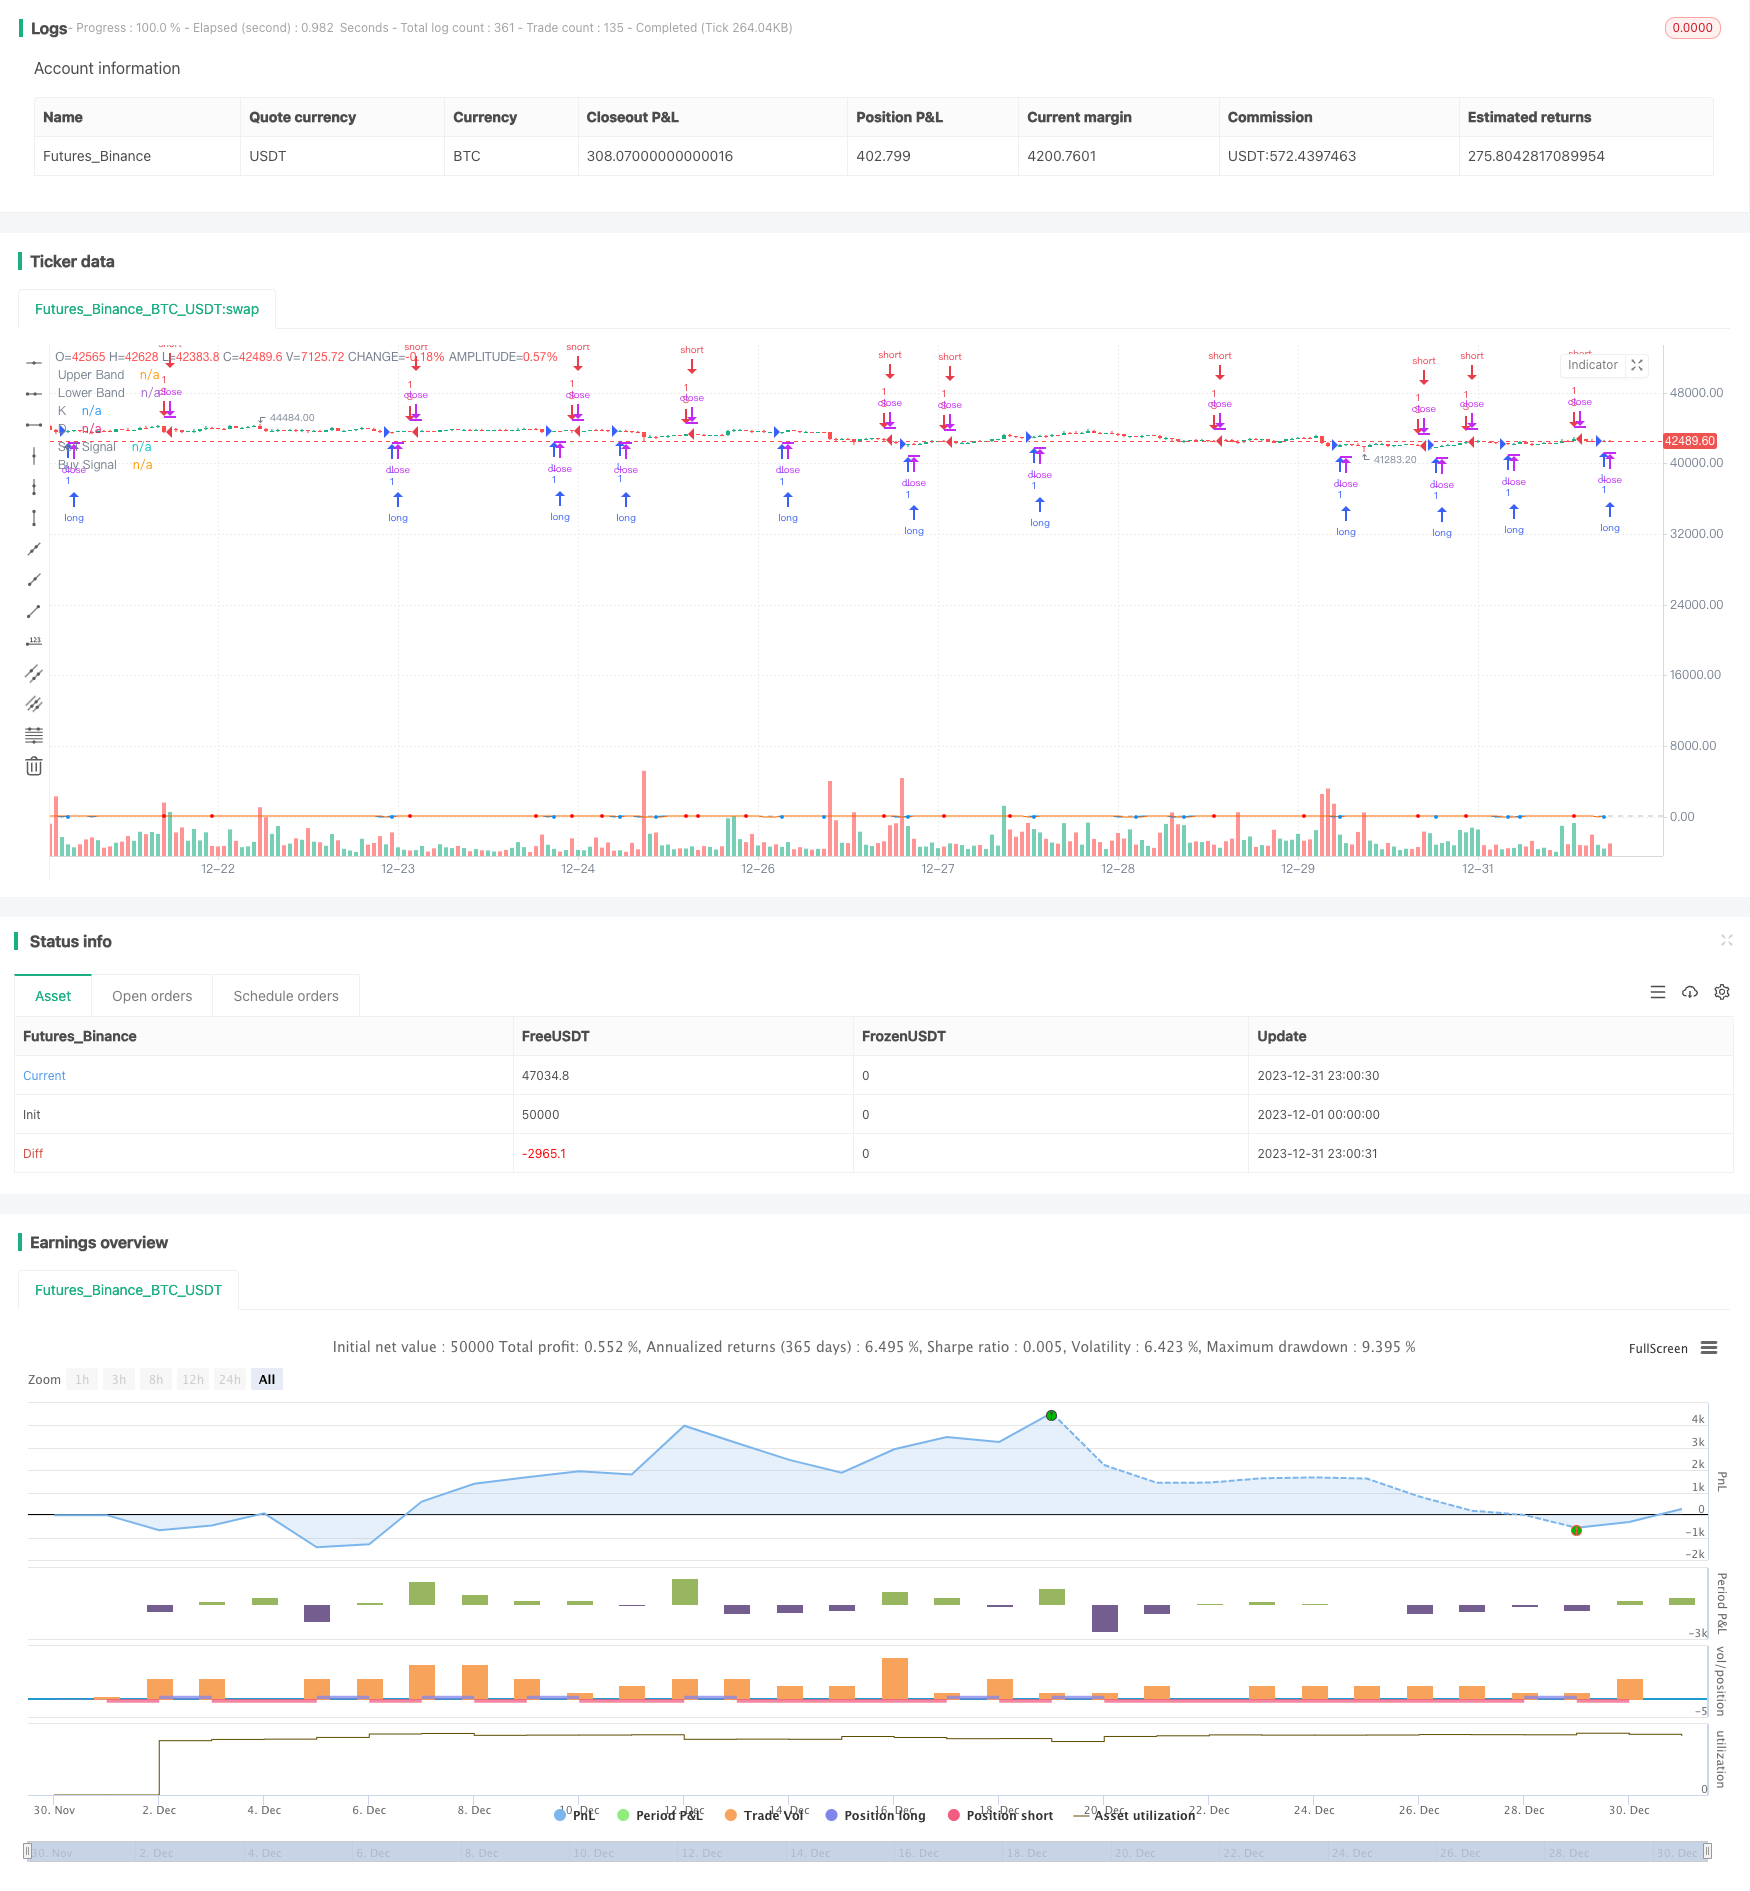
概述
该策略的主要思想是利用埃尔斯(Ehlers)超平滑(SuperSmoother)筛选器对随机相对强弱指数(Stochastic RSI)指标进行加工处理,从而过滤掉许多假信号,获得更加可靠的交易信号。基本原理是先计算随机相对强弱指数,然后使用埃尔斯超平滑筛选器对其进行平滑化处理,最后与其自身的移动平均线进行交叉做多做空。
策略原理
该策略首先计算日志收盘价的 RSI 指标,然后基于 RSI 指标计算 Stochastic 指标,这是典型的相对强弱指数指标。为了过滤假信号,使用埃尔斯超平滑筛选器对 Stochastic RSI 进行加工,最后 Stochastic RSI 线与其自身的移动平均线进行黄金交叉做多,死叉做空。所以该策略的关键点有:1)计算 Stochastic RSI 指标;2)使用埃尔斯超平滑筛选器;3)与移动平均线形成交易信号。
优势分析
该策略最大的优势在于使用埃尔斯超平滑筛选器,可以有效过滤掉许多假信号,使得交易信号更加可靠。另外,Stochastic RSI 指标本身就具有很好的突破性和趋势跟踪能力。所以该策略可以正确识别趋势,在合适的时候建仓,在合适的时候平仓。
风险分析
该策略的主要风险在于市场大幅震荡时,容易产生错误信号。当价格在较窄范围内大幅波动时,Stochastic RSI 指标会产生许多上冲和下冲的假信号,这时埃尔斯超平滑筛选器的效果也会打折扣。此外,在某些剧烈行情中,指标的滞后性也可能带来一定的风险。
为了降低这些风险,可以适当调整参数,如调大 Stochastic 指标周期,调小平滑度等,从而进一步过滤假信号。另外,也可以考虑与其它指标或形态进行组合,形成多重过滤条件,避免错误信号带来的风险。
优化方向
该策略主要可以从以下几个方面进行优化:
优化参数设置。可以对 Stochastic RSI 指标的长度、平滑常数等参数进行细致测试,找到最佳的参数组合。
增加止损机制。可以设定移动止损或挂单止损来锁定利润,降低回撤。
与其它指标或形态组合。可以考虑与波动率指标、移动平均线等进行组合,形成多重过滤条件,进一步减少风险。
根据大周期分析结果调整仓位。可以根据更高时间周期的趋势分析结果,动态调整每次交易的头寸规模。
总结
本策略首先计算 Stochastic RSI 指标,然后使用埃尔斯超平滑筛选器对其进行加工处理,最后与自身的移动平均线形成交易信号,实现对趋势的正确判断。策略优势在于指标和过滤器的组合使用,可以有效过滤假信号,获得高概率的交易机会。风险主要来自参数设置不当和止损机制缺失。通过参数优化、止损添加及组合优化等手段,可以进一步提高策略的稳定性和盈利水平。
/*backtest
start: 2023-12-01 00:00:00
end: 2023-12-31 23:59:59
period: 1h
basePeriod: 15m
exchanges: [{"eid":"Futures_Binance","currency":"BTC_USDT"}]
*/

//@version=3
strategy("ES Stoch RSI Strategy [krypt]", overlay=true, calc_on_order_fills=true, calc_on_every_tick=true, initial_capital=10000, currency='USD')

//Backtest Range
FromMonth = input(defval = 06, title = "From Month", minval = 1)
FromDay   = input(defval = 1, title = "From Day", minval = 1)
FromYear  = input(defval = 2018, title = "From Year", minval = 2014)
ToMonth   = input(defval = 7, title = "To Month", minval = 1)
ToDay     = input(defval = 30, title = "To Day", minval = 1)
ToYear    = input(defval = 2018, title = "To Year", minval = 2014)

PI = 3.14159265359

drop1st(src) =>
    x = na
    x := na(src[1]) ? na : src

xlowest(src, len) =>
    x = src
    for i = 1 to len - 1
        v = src[i]
        if (na(v))
            break
        x := min(x, v)
    x

xhighest(src, len) =>
    x = src
    for i = 1 to len - 1
        v = src[i]
        if (na(v))
            break
        x := max(x, v)
    x

xstoch(c, h, l, len) =>
    xlow = xlowest(l, len)
    xhigh = xhighest(h, len)
    100 * (c - xlow) / (xhigh - xlow)

Stochastic(c, h, l, length) =>
    rawsig = xstoch(c, h, l, length)
    min(max(rawsig, 0.0), 100.0)

xrma(src, len) =>
    sum = na
    sum := (src + (len - 1) * nz(sum[1], src)) / len

xrsi(src, len) =>
    msig = nz(change(src, 1), 0.0)
    up = xrma(max(msig, 0.0), len)
    dn = xrma(max(-msig, 0.0), len)
    rs = up / dn
    100.0 - 100.0 / (1.0 + rs)

EhlersSuperSmoother(src, lower) =>
	a1 = exp(-PI * sqrt(2) / lower)
	coeff2 = 2 * a1 * cos(sqrt(2) * PI / lower)
	coeff3 = -pow(a1, 2)
	coeff1 = (1 - coeff2 - coeff3) / 2
	filt = na
	filt := nz(coeff1 * (src + nz(src[1], src)) + coeff2 * filt[1] + coeff3 * filt[2], src)

smoothK = input(7, minval=1, title="K")
smoothD = input(2, minval=1, title="D")
lengthRSI = input(10, minval=1, title="RSI Length")
lengthStoch = input(3, minval=1, title="Stochastic Length")
showsignals = input(true, title="Buy/Sell Signals")
src = input(close,  title="Source")

ob = 80
os = 20
midpoint = 50

price = log(drop1st(src))
rsi1 = xrsi(price, lengthRSI)
rawsig = Stochastic(rsi1, rsi1, rsi1, lengthStoch)
sig = EhlersSuperSmoother(rawsig, smoothK)
ma = sma(sig, smoothD)

plot(sig, color=#0094ff, title="K", transp=0)
plot(ma, color=#ff6a00, title="D", transp=0)
lineOB = hline(ob, title="Upper Band", color=#c0c0c0)
lineOS = hline(os, title="Lower Band", color=#c0c0c0)
fill(lineOB, lineOS, color=purple, title="Background")

// Buy/Sell Signals

// use curvature information to filter out some false positives
mm1 = change(change(ma, 1), 1)
mm2 = change(change(ma, 2), 2)
ms1 = change(change(sig, 1), 1)
ms2 = change(change(sig, 2), 2)

sellsignals = showsignals and (mm1 + ms1 < 0 and mm2 + ms2 < 0) and crossunder(sig, ma) and sig[1] > ob
buysignals = showsignals and (mm1 + ms1 > 0 and mm2 + ms2 > 0) and crossover(sig, ma) and sig[1] < os

ploff = 4
plot(buysignals ? sig[1] - ploff : na, style=circles, color=#008fff, linewidth=3, title="Buy Signal", transp=0)
plot(sellsignals ? sig[1] + ploff : na, style=circles, color=#ff0000, linewidth=3, title="Sell Signal", transp=0)

longCondition = buysignals
if (longCondition)
    strategy.entry("L", strategy.long, comment="Long", when=(buysignals))

shortCondition = sellsignals
if (shortCondition)
    strategy.entry("S", strategy.short, comment="Short", when=(sellsignals))