概述
三重EMA随机RSI交叉金叉策略是一种趋势跟踪策略。它结合了三重指数移动平均线指标和随机指数相对强弱指标,通过双重指标的交叉信号来判断入场时机。
策略原理
该策略的信号判断基于以下逻辑:
三重EMA判断趋势:8日线在上,14日线在中,50日线在下构成多头趋势,反之构成空头趋势。
随机RSI指标判断交叉:K线从下方向上穿过D线产生金叉信号,表示强势进入。
只做多头,空头暂不考虑。
当三重EMA呈现上行趋势,且随机RSI出现金叉时,做多。在此基础上设置止损和止盈线来锁定利润。
优势分析
该策略结合双重指标判断,能有效锁定趋势。主要优势如下:
三重EMA过滤掉短期噪音,锁定中长线趋势。
随机RSI金叉确认强势进入。
ATR智能止损止盈,锁定利润。
策略逻辑简单清晰,容易理解和实施。
风险分析
该策略主要风险如下:
大盘震荡时容易被套。当三重EMA指标在震荡中产生多次金叉死叉时,会频繁开仓建仓带来交易风险。可通过优化EMA参数或增加其他过滤指标来解决。
没有做空机会。只做多会错过底部反弹机会。可考虑加入 MACD 等指标,在空头趋势中寻找做空机会。
优化方向
该策略主要可优化的方向包括:
优化EMA参数,改进趋势判断。
增加MACD等指标,判断空头趋势,增加做空机会。
增加波动率指标,如ATR,改进止损止盈设定。
结合交易量指标,避免虚假突破。
利用机器学习等技术进行参数优化。
总结
总的来说,该三重EMA随机RSI交叉策略结合双重指标判断,可以有效过滤震荡、锁定趋势,是一种简单实用的趋势跟踪策略。通过继续优化参数、增加过滤指标、利用先进技术等手段,可以获得更好的策略表现。
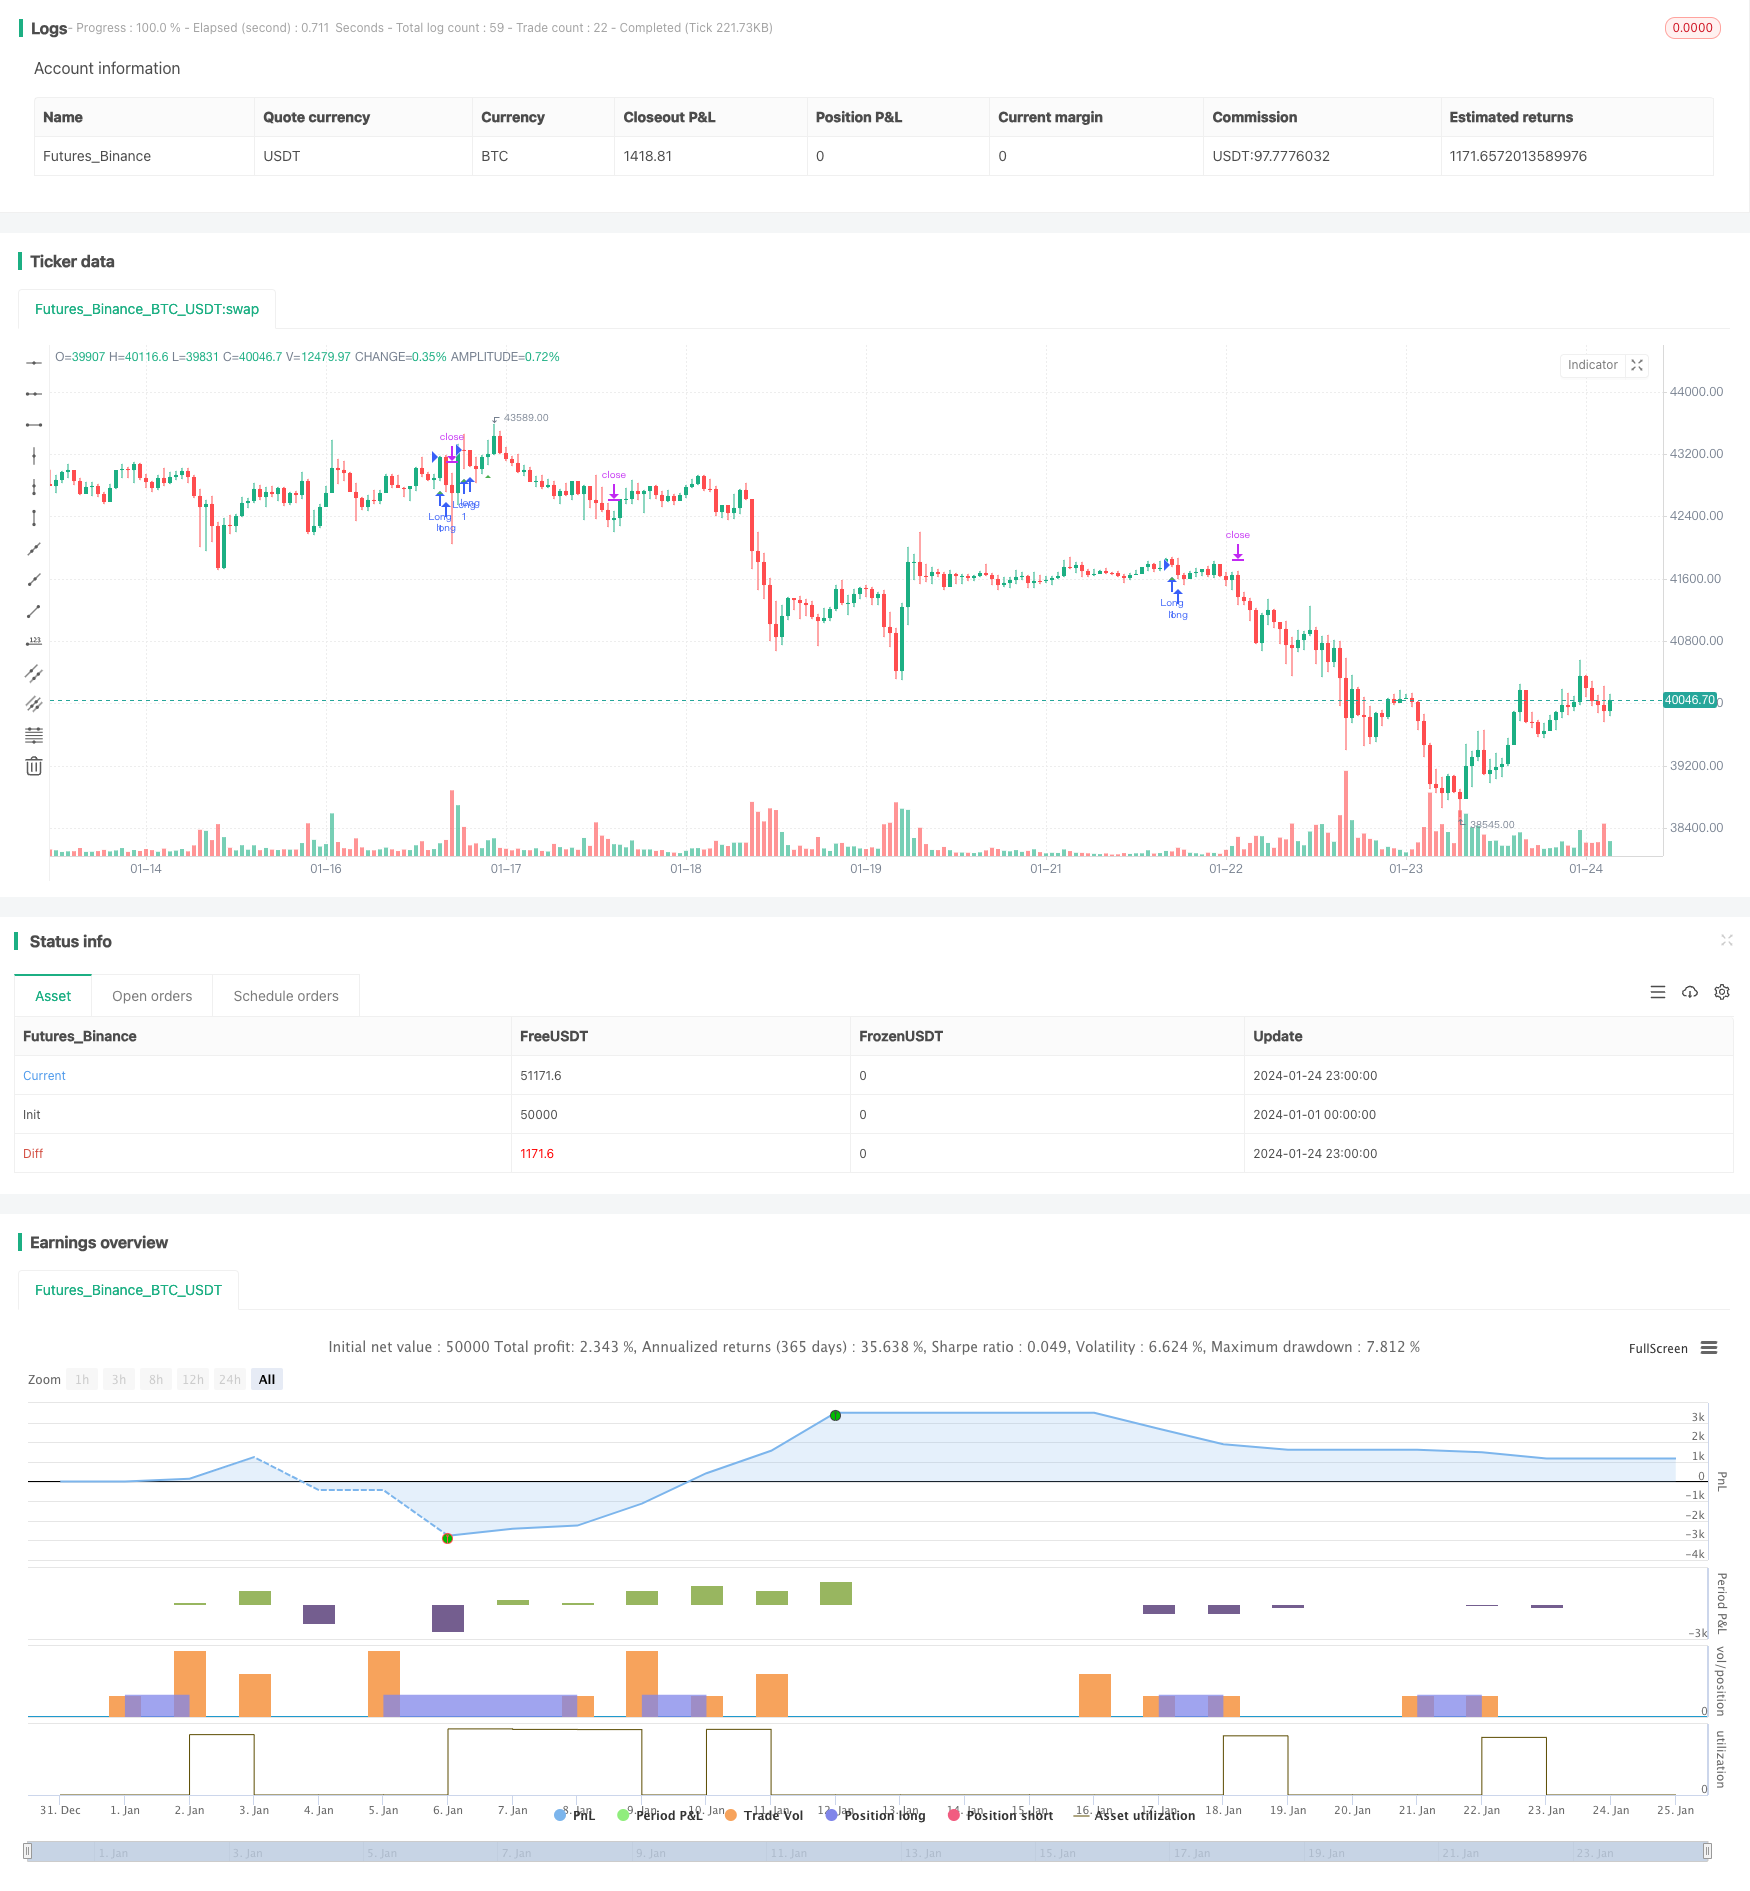
策略源码
/*backtest
start: 2024-01-01 00:00:00
end: 2024-01-25 00:00:00
period: 1h
basePeriod: 15m
exchanges: [{"eid":"Futures_Binance","currency":"BTC_USDT"}]
*/

//@version=4

strategy(title="Stoch RSI Crossover Strat + EMA", shorttitle="Stoch RSI Cross + EMA Strat", overlay = true)

// Time Range
FromMonth=input(defval=1,title="FromMonth",minval=1,maxval=12)
FromDay=input(defval=1,title="FromDay",minval=1,maxval=31)
FromYear=input(defval=2020,title="FromYear",minval=2017)
ToMonth=input(defval=1,title="ToMonth",minval=1,maxval=12)
ToDay=input(defval=1,title="ToDay",minval=1,maxval=31)
ToYear=input(defval=9999,title="ToYear",minval=2017)
start=timestamp(FromYear,FromMonth,FromDay,00,00)
finish=timestamp(ToYear,ToMonth,ToDay,23,59)
window()=>true

// See if this bar's time happened on/after start date
afterStartDate = time >= start and time<=finish?true:false

//STOCH RSI
smoothK = input(3, minval=1)
smoothD = input(3, minval=1)
lengthRSI = input(14, minval=1)
lengthStoch = input(14, minval=1)
src = input(close, title="RSI Source")

rsi1 = rsi(src, lengthRSI)
k = sma(stoch(rsi1, rsi1, rsi1, lengthStoch), smoothK)
d = sma(k, smoothD)

//ATR
lengthATR = input(title="ATR Length", defval=14, minval=1)
atr = atr(lengthATR)

//MULTI EMA
emasrc = close,
len1 = input(8, minval=1, title="EMA 1")
len2 = input(14, minval=1, title="EMA 2")
len3 = input(50, minval=1, title="EMA 3")

ema1 = ema(emasrc, len1)
ema2 = ema(emasrc, len2)
ema3 = ema(emasrc, len3)

col1 = color.lime
col2 = color.blue
col3 = color.orange

//EMA Plots
//plot(ema1, title="EMA 1", linewidth=1, color=col1)
//plot(ema2, title="EMA 2", linewidth=1, color=col2)
//plot(ema3, title="EMA 3", linewidth=1, color=col3)

crossup = k[0] > d[0] and k[1] <= d[1]
emapos = ema1 > ema2 and ema2 > ema3 and close > ema1
barbuy = crossup and emapos

//plotshape(crossup, style=shape.triangleup, location=location.belowbar, color=color.white)
plotshape(barbuy, style=shape.triangleup, location=location.belowbar, color=color.green)

longloss = sma(open, 1)
//plot(longloss, color=color.red)

//Buy and Sell Factors
profitfactor = input(title="Profitfactor", type=input.float, step=0.1, defval=2)
stopfactor = input(title="Stopfactor", type=input.float, step=0.1, defval=3)
bought = strategy.position_size[1] < strategy.position_size
longcondition = barbuy

if (longcondition) and (afterStartDate) and strategy.opentrades < 1
    strategy.entry("Long", strategy.long)

if (afterStartDate) and strategy.opentrades > 0
    barsbought = barssince(bought)
    profit_level = strategy.position_avg_price + (atr*profitfactor)
    stop_level = strategy.position_avg_price - (atr*stopfactor)
    strategy.exit("Take Profit/ Stop Loss", "Long", stop=stop_level[barsbought], limit=profit_level[barsbought])