概述
本策略通过组合双指数移动平均线和三条Williams平均线,形成一个综合的趋势跟踪和趋势反转信号产生系统。它具有优异的持仓效率,可以有效过滤假信号。
策略原理
本策略主要由两个子策略组成:
双指数移动平均线(Double Exponential Moving Average,DEMA)。该指标结合了单指数移动平均线的趋势跟踪性能,以及双指数移动平均线的滞后性。当价格上涨时,它可以更快地做多;当价格下跌时,它也可以更快地平仓。
Williams三条平均线。该指标由长线、中线和短线组成。它利用不同周期平均线的交叉来判断趋势的变化,以产生交易信号。当短线上穿中线和中线上穿长线时为做多信号。当短线下穿中线和中线下穿长线时为做空信号。
本策略的交易信号是将上述两个子策略的结果进行“与”运算。也就是说,只有当两个子策略同时发出信号时,本策略才会出发订单。这可以有效地减少假信号,提高持仓的稳定性。
优势分析
本策略最大的优势在于可以有效地过滤假信号,这是由其策略结构所决定的。虽然双移动平均线和Williams平均线各有其缺点,但把两者组合在一起,就可以发挥各自的优势,互相补偿。这使得本策略可以在趋势行情中实现高效的持仓,而在盘整行情中可以及时止损。
此外,本策略参数优化空间大,可以通过调整双移动平均线的参数和Williams三条平均线的参数,来适应不同品种和周期的行情特点,具有较强的适应性。
风险分析
本策略的主要风险在于当行情陷入剧烈波动时,止损点可能会被突破,造成较大的亏损。这是移动平均线策略普遍存在的问题。此外,在震荡行情中,本策略可能会频繁开仓平仓,增加交易费用的损耗。
为了控制这些风险,建议优化参数时采用Walk Forward Analysis方法,并设置合理的止损点。同时,也可以引入附加指标判断行情状态,在震荡行情中暂停交易。
优化方向
本策略有以下几个优化方向:
调整双移动平均线的参数,适应不同品种和周期。
调整Williams平均线的三条线周期,适应市场波动频率。
增加开仓条件,在特定行情阶段过滤交易信号。例如在剧烈波动中不交易。
增加止损指标以控制亏损。可以试验追踪止损、平均止损等方法。
引入机器学习算法自动优化参数。
总结
本策略通过组合双移动平均线和Williams平均线的优势,实现了交易信号的有效过滤,可以减少假信号,提高持仓效率。它可根据市场行情通过参数优化获得更好的绩效,具有很大的应用潜力。同时也需要注意风险管理,控制行情剧烈波动带来的亏损。
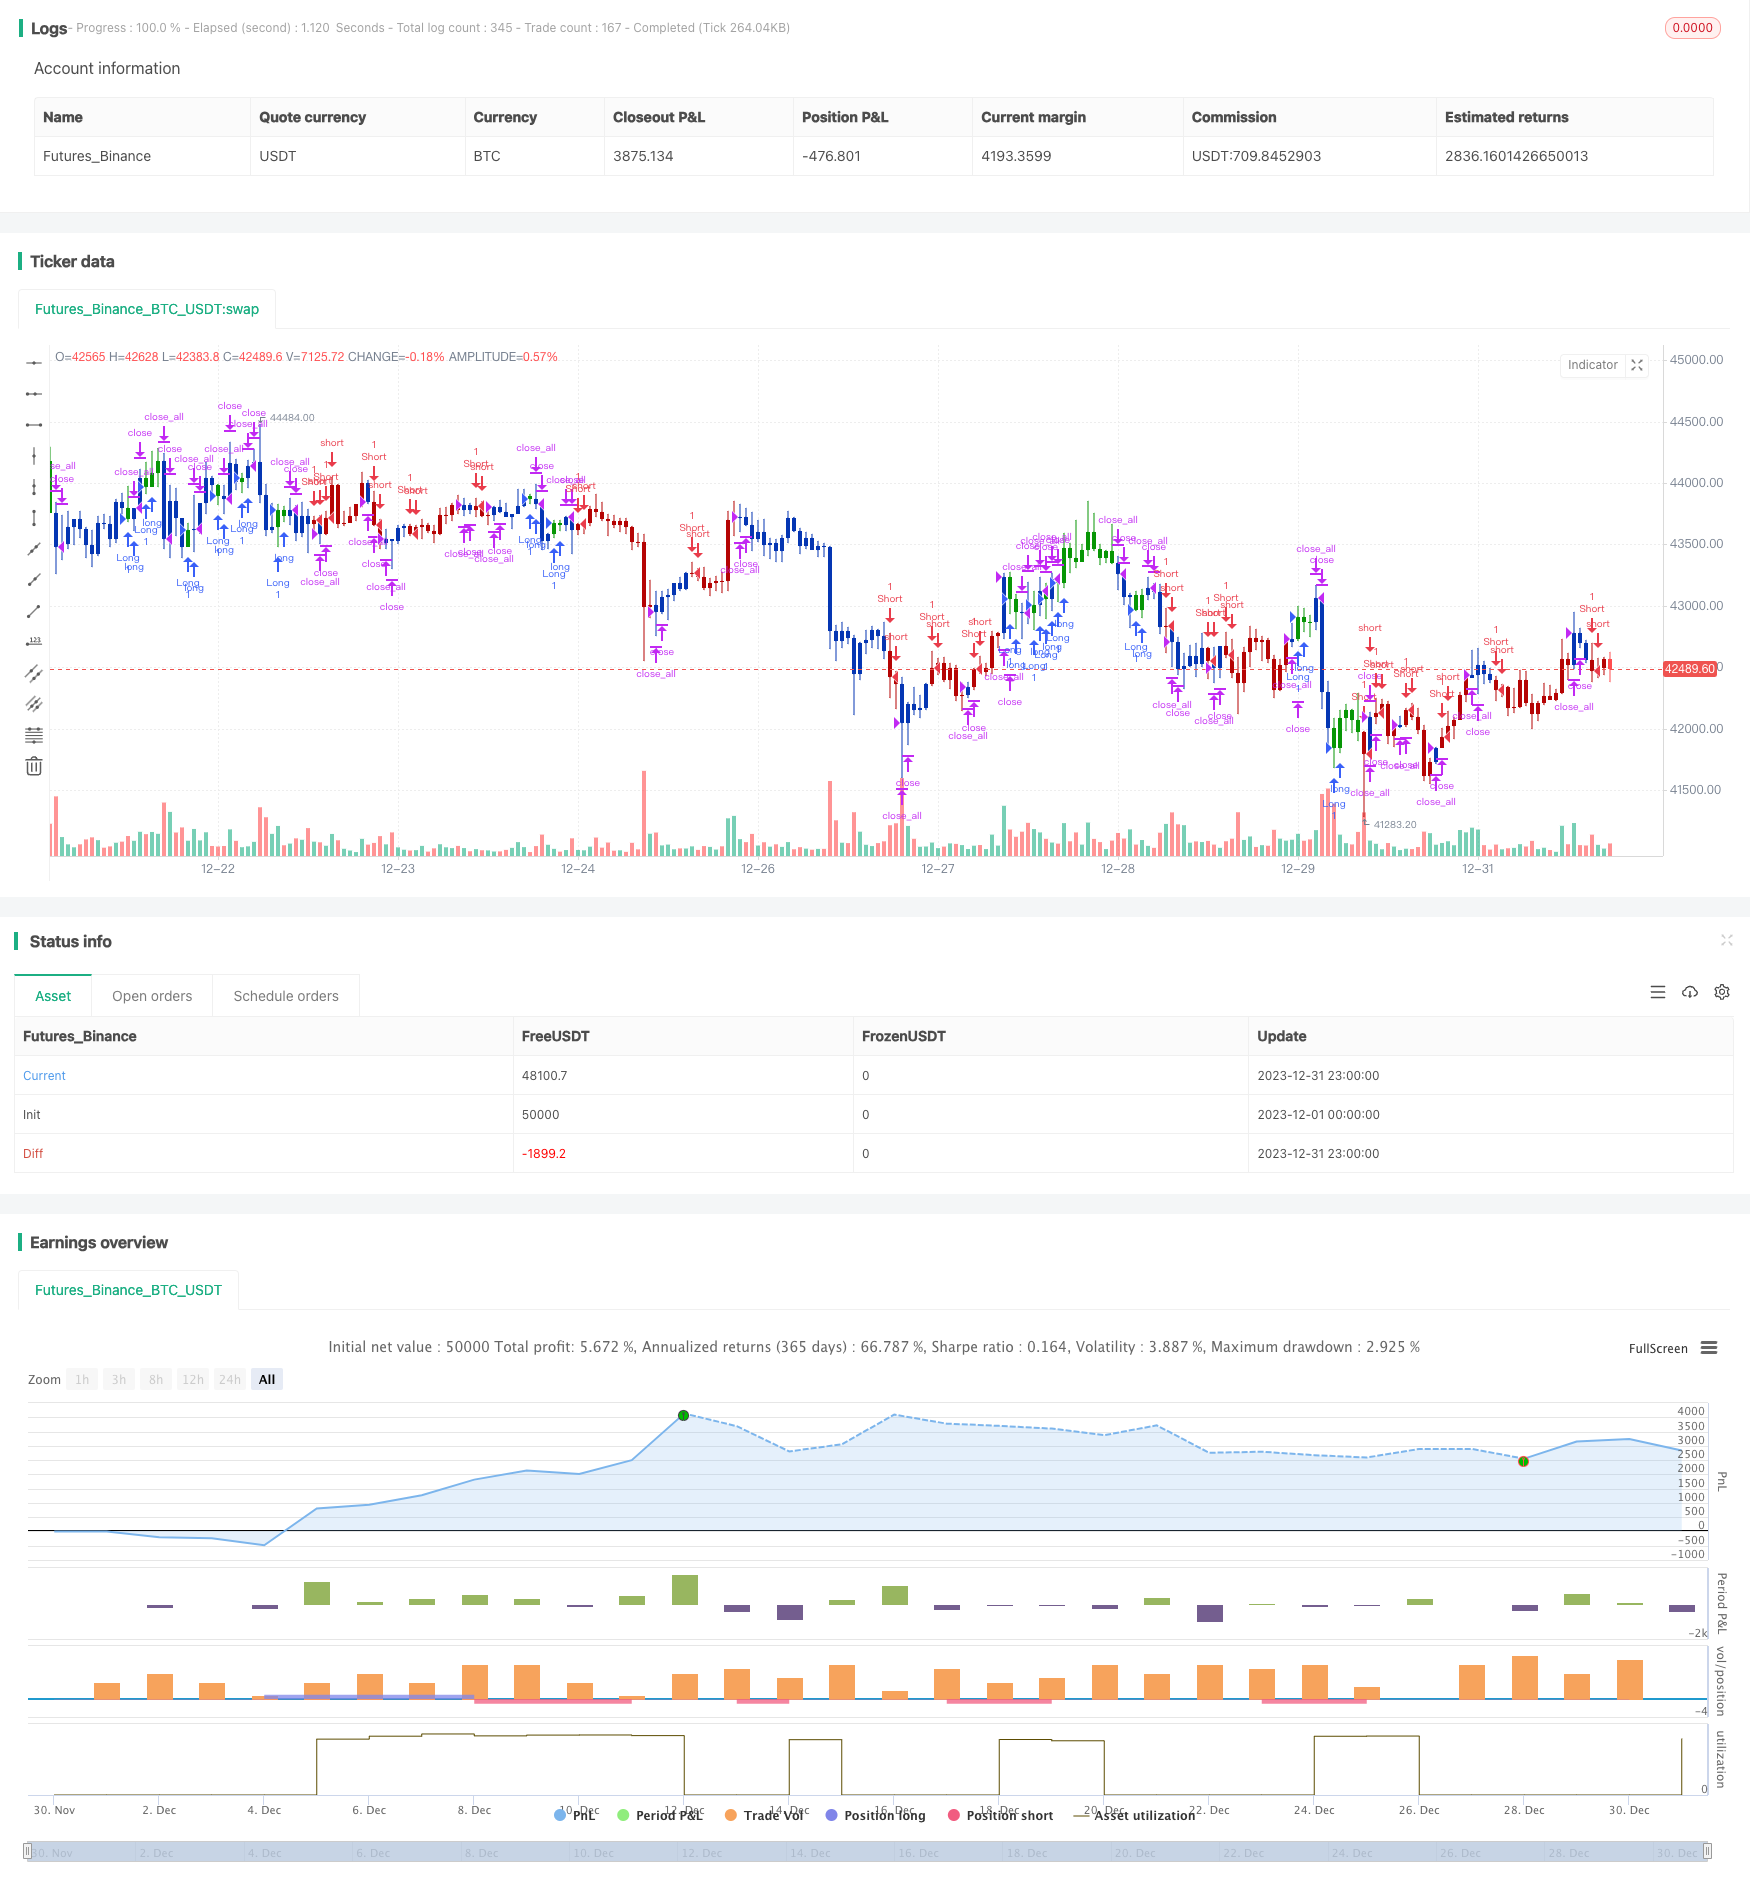
/*backtest
start: 2023-12-01 00:00:00
end: 2023-12-31 23:59:59
period: 1h
basePeriod: 15m
exchanges: [{"eid":"Futures_Binance","currency":"BTC_USDT"}]
*/

//@version=5
////////////////////////////////////////////////////////////
//  Copyright by HPotter v1.0 21/04/2022
// This is combo strategies for get a cumulative signal.
//
// First strategy
// This indicator plots 2/20 exponential moving average. For the Mov
// Avg X 2/20 Indicator, the EMA bar will be painted when the Alert criteria is met.
//
// Second strategy
// This indicator calculates 3 Moving Averages for default values of
// 13, 8 and 5 days, with displacement 8, 5 and 3 days: Median Price (High+Low/2).
// The most popular method of interpreting a moving average is to compare
// the relationship between a moving average of the security's price with
// the security's price itself (or between several moving averages).
//
//
// WARNING:
// - For purpose educate only
// - This script to change bars colors.
////////////////////////////////////////////////////////////
EMA20(Length) =>
    pos = 0.0
    xPrice = close
    xXA = ta.ema(xPrice, Length)
    nHH = math.max(high, high[1])
    nLL = math.min(low, low[1])
    nXS = nLL > xXA or nHH < xXA ? nLL : nHH
    iff_1 = nXS < close[1] ? 1 : nz(pos[1], 0)
    pos := nXS > close[1] ? -1 : iff_1
    pos


BWA3Lines(LLength,MLength,SLength,LOffset,MOffset,SOffset) =>
    pos = 0.0
    xLSma = ta.sma(hl2, LLength)[LOffset]
    xMSma = ta.sma(hl2, MLength)[MOffset]
    xSSma = ta.sma(hl2, SLength)[SOffset]
    pos := close < xSSma and xSSma < xMSma and xMSma < xLSma ? -1 :
    	     close > xSSma and xSSma > xMSma and xMSma > xLSma ? 1 : nz(pos[1], 0)
    pos

strategy(title='Combo 2/20 EMA & Bill Williams Averages. 3Lines', shorttitle='Combo', overlay=true)
var I1 = '●═════ 2/20 EMA ═════●'
Length = input.int(14, minval=1, group=I1)
var I2 = '●═════ 3Lines ═════●'
LLength = input.int(13, minval=1, group=I2)
MLength = input.int(8,minval=1, group=I2)
SLength = input.int(5,minval=1, group=I2)
LOffset = input.int(8,minval=1, group=I2)
MOffset = input.int(5,minval=1, group=I2)
SOffset = input.int(3,minval=1, group=I2)
var misc = '●═════ MISC ═════●'
reverse = input.bool(false, title='Trade reverse', group=misc)
var timePeriodHeader = '●═════ Time Start ═════●'
d = input.int(1, title='From Day', minval=1, maxval=31, group=timePeriodHeader)
m = input.int(1, title='From Month', minval=1, maxval=12, group=timePeriodHeader)
y = input.int(2005, title='From Year', minval=0, group=timePeriodHeader)
StartTrade = time > timestamp(y, m, d, 00, 00) ? true : false
posEMA20 = EMA20(Length)
prePosBWA3Lines = BWA3Lines(LLength,MLength,SLength,LOffset,MOffset,SOffset)
iff_1 = posEMA20 == -1 and prePosBWA3Lines == -1 and StartTrade ? -1 : 0
pos = posEMA20 == 1 and prePosBWA3Lines == 1 and StartTrade ? 1 : iff_1
iff_2 = reverse and pos == -1 ? 1 : pos
possig = reverse and pos == 1 ? -1 : iff_2
if possig == 1
    strategy.entry('Long', strategy.long)
if possig == -1
    strategy.entry('Short', strategy.short)
if possig == 0
    strategy.close_all()
barcolor(possig == -1 ? #b50404 : possig == 1 ? #079605 : #0536b3)