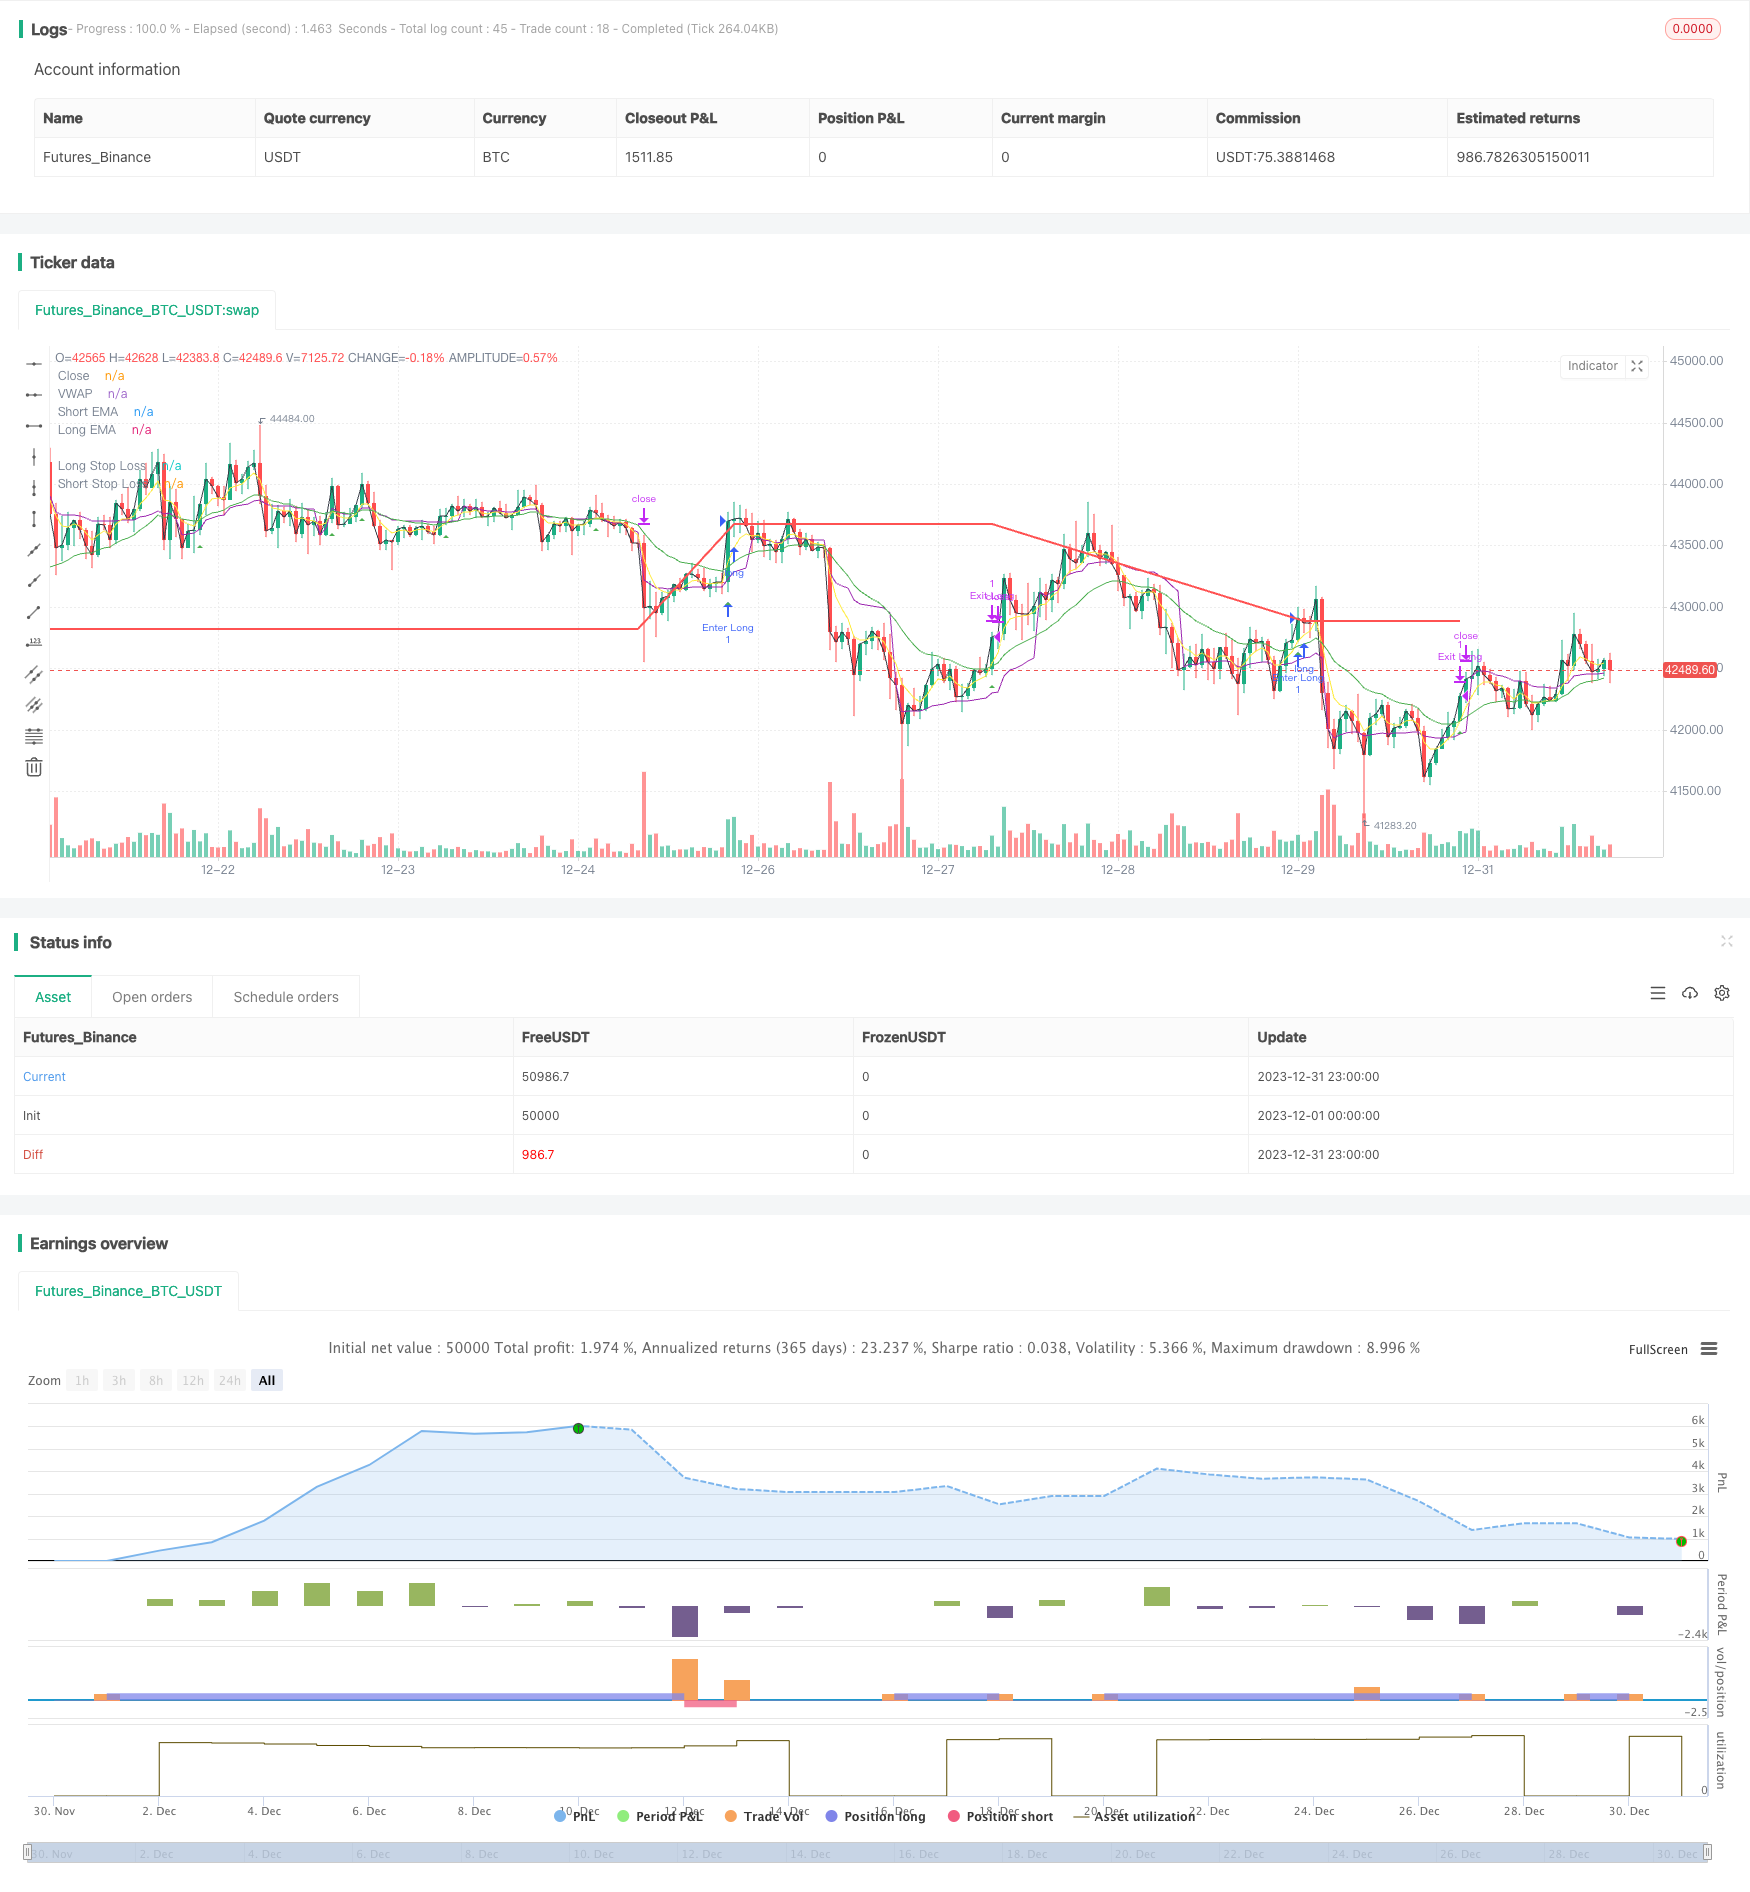
概述
本策略基于EMA平均线的金叉死叉进行双向追踪,并设置动态的长短仓止损线,实现对趋势行情的捕捉。
策略原理
- 计算快速EMA线(5日)和慢速EMA线(20日)
- 当快速线从下方向上穿过慢速线时,做多;当快速线从上方向下穿过慢速线时,做空
- 做多后,设置动态止损线为入场价(1-长仓止损百分比);做空后,设置动态止损线为入场价(1+短仓止损百分比)
- 一旦价格触发相应的止损线,则止损出场
优势分析
- EMA平均线追踪趋势的能力较强,双向穿越形成计时器,可以有效锁定趋势机会
- 动态计算止损线,实现盈利后随行就市,可以最大程度锁定趋势利润
- 采用vwap作为附加过滤条件,避免被套,提高信号质量
风险分析
- 纯趋势策略,行情震荡时容易被套
- 止损过于宽松,可能造成亏损放大
- EMA均线生成信号的滞后性可能错过行情最佳点位
可以通过采用ATR进行风险管控,优化短期止损策略,或者结合其他指标过滤噪音交易等方法进行优化。
优化方向
- 结合ATR或DONCH等动态止损指标,设置更适应市场的止损线
- 增加其他技术指标过滤信号,如MACD、KDJ等,减少误入误出
- 优化参数,寻找最佳的快慢均线长度组合
- 可以尝试机器学习方法寻找最优参数
总结
本策略整体来说是一个非常典型的趋势跟踪策略。双EMA形成金叉死叉,动态止损,可以有效锁定趋势获利。同时也存在一定的滞后性风险和止损过宽的风险。通过参数优化、风险管理、信号过滤等方法可以获得更好的策略表现。
策略源码
/*backtest
start: 2023-12-01 00:00:00
end: 2023-12-31 23:59:59
period: 1h
basePeriod: 15m
exchanges: [{"eid":"Futures_Binance","currency":"BTC_USDT"}]
*/

//@version=5

strategy("EMA Crossover Strategy", shorttitle="EMAC", overlay=true,calc_on_every_tick=true)

// Input parameters
shortEmaLength = input(5, title="Short EMA Length")
longEmaLength = input(20, title="Long EMA Length")
priceEmaLength = input(1, title="Price EMA Length")

// Set stop loss level with input options (optional)
longLossPerc = input.float(0.05, title="Long Stop Loss (%)",
     minval=0.0, step=0.1) * 0.01

shortLossPerc = input.float(0.05, title="Short Stop Loss (%)",
     minval=0.0, step=0.1) * 0.01

// Calculating indicators
shortEma = ta.ema(close, shortEmaLength)
longEma = ta.ema(close, longEmaLength)
//priceEma = ta.ema(close, priceEmaLength)
vwap = ta.vwap(close)

// Long entry conditions
longCondition = ta.crossover(shortEma, longEma) and close > vwap
// Short entry conditions
shortCondition = ta.crossunder(shortEma, longEma) and close > vwap

// STEP 2:
// Determine stop loss price
longStopPrice  = strategy.position_avg_price * (1 - longLossPerc)
shortStopPrice = strategy.position_avg_price * (1 + shortLossPerc)


if (longCondition)
    strategy.entry("Enter Long", strategy.long)
    strategy.exit("Exit Long",from_entry = "Enter Long",stop= longStopPrice)
plotshape(series=longCondition, title="Long Signal", color=color.green, style=shape.triangleup, location=location.belowbar)


if (shortCondition)
    strategy.entry("Enter Short", strategy.short)
    strategy.exit("Exit Short", from_entry = "Enter Short",stop = shortStopPrice)
plotshape(series=shortCondition, title="Short Signal", color=color.red, style=shape.triangledown, location=location.abovebar)

// Stop loss levels
//longStopLoss = (1 - stopLossPercent) * close
//shortStopLoss = (1 + stopLossPercent) * close

// Exit conditions
//strategy.exit("Long", from_entry="Long", loss=longStopLoss)
//strategy.exit("Short", from_entry="Short", loss=shortStopLoss)

// Plotting indicators on the chart
plot(shortEma, color=color.yellow, title="Short EMA")
plot(longEma, color=color.green, title="Long EMA")
plot(close, color=color.black, title="Close")
plot(vwap, color=color.purple, title="VWAP")

// Plot stop loss values for confirmation
plot(strategy.position_size > 0 ? longStopPrice : na,
     color=color.red, style=plot.style_line,
     linewidth=2, title="Long Stop Loss")

plot(strategy.position_size < 0 ? shortStopPrice : na,
     color=color.blue, style=plot.style_line,
     linewidth=2, title="Short Stop Loss")
// Plotting stop loss lines
//plot(longStopLoss, color=color.red, title="Long Stop Loss", linewidth=2, style=plot.style_line)
//plot(shortStopLoss, color=color.aqua, title="Short Stop Loss", linewidth=2, style=plot.style_line)