概述
布林带突破策略是一种只做多头的momentum追踪策略。它利用布林带的上轨和下轨来判断价格动能,并在价格突破上轨时做多,在价格跌破下轨或移动平均线时平仓。
策略原理
该策略首先计算N日移动平均线作为基准线,然后在基准线上下各添加K倍标准差构建上轨和下轨,从而形成布林带。当价格突破上轨时,表示价格出现向上突破,属于金叉信号,此时策略会开仓做多;当价格跌破下轨或移动平均线时,表示价格出现向下回落,属于死叉信号,此时策略会平仓清仓。
由于布林带上轨和下轨能够动态地包含价格数据的大部分分布,所以它们代表了当前市场价格的合理波动范围。当价格突破该合理波动范围,就意味着市场出现异常,需要及时调整仓位。这就是该策略的基本判断逻辑。
优势分析
该策略有以下几个优势:
- 能够有效捕捉价格趋势,及时追踪市场momentum
- 利用布林带判断异常突破,不易假突破
- 规则清晰易执行,容易量化实现
- 可根据市场波动率选取合适的参数,优化策略
风险分析
该策略也存在一些风险:
- 市场出现剧烈波动时,布林带判断会失效
- 无法判断市场实际趋势,可能追高杀跌
- 存在一定的时间滞后
- 没有考虑交易成本,实际操作效果会打折扣
为了控制这些风险,可以结合趋势判断指标,譬如MACD;也可以适当调整参数,缩小布林带范围来降低错误信号。
优化方向
该策略还可以从以下几个方向进行优化:
- 结合交易量指标判断真实突破
- 利用自适应布林带实时优化参数
- 结合止损策略,控制单笔损失
- 增加持仓优化机制,根据市场情况动态调整仓位
通过以上几点优化,可以进一步提高策略稳定性,并减少交易风险。
总结
布林带突破策略整体来说是一种较为经典的追踪趋势策略。它有比较清晰的判断逻辑和易操作的特点,适合量化交易。但也存在一定缺陷,需要进一步优化以适应复杂多变的市场环境。如果能与其他指标和策略机制有效结合,就能大幅提高效果。
策略源码
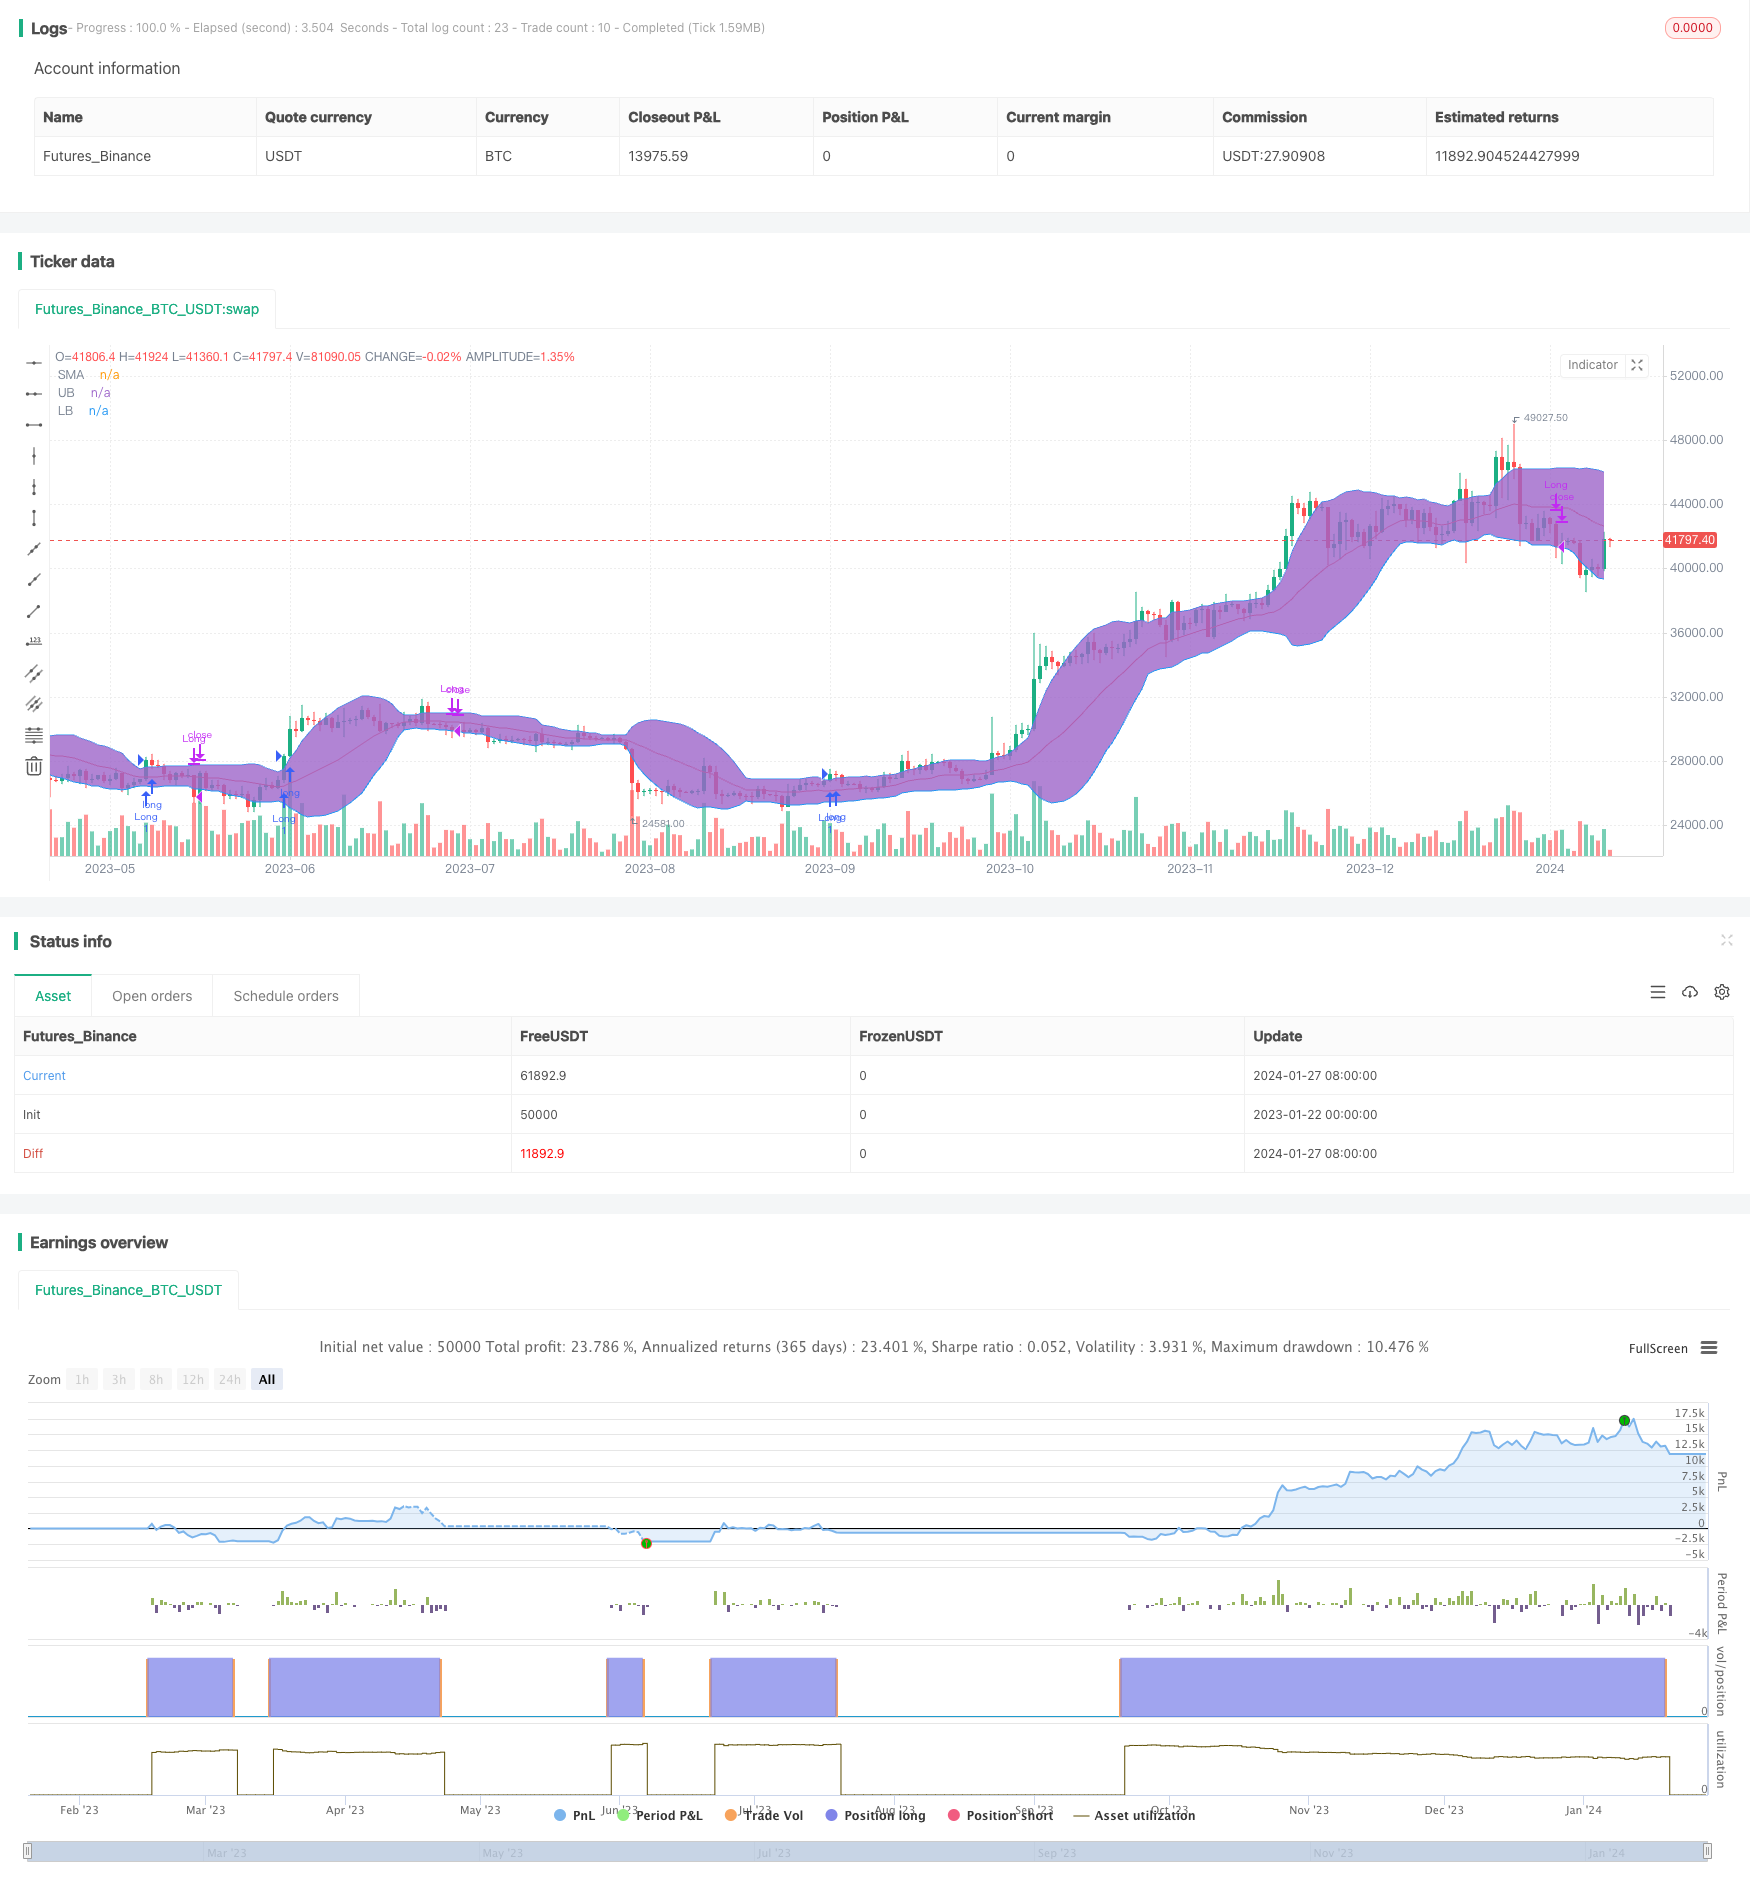
/*backtest
start: 2023-01-22 00:00:00
end: 2024-01-28 00:00:00
period: 1d
basePeriod: 1h
exchanges: [{"eid":"Futures_Binance","currency":"BTC_USDT"}]
*/

// This source code is subject to the terms of the Mozilla Public License 2.0 at https://mozilla.org/MPL/2.0/
// © Senthaamizh

//@version=4
strategy(title="Bollinger Band Breakout", shorttitle = "BB-BO", overlay=true)
source = close
length = input(20, minval=1, title = "Period") //Length of the Bollinger Band
mult = input(1.5, minval=0.001, maxval=50, title = "Standard Deviation") // Use 1.5 SD for 20 period MA; Use 2 SD for 10 period MA
exit = input(1, minval=1, maxval=2,title = "Exit Option") // Use Option 1 to exit using lower band; Use Option 2 to exit using moving average

basis = sma(source, length)
dev = mult * stdev(source, length)

upper = basis + dev
lower = basis - dev

if (crossover(source, upper))
    strategy.entry("Long", strategy.long, qty=1)

if(exit==1)
    if (crossunder(source, lower))
        strategy.close("Long")

if(exit==2) //basis is good for N50 but lower is good for BN (High volatility)
    if (crossunder(source, basis))
        strategy.close("Long")

plot(basis, color=color.red,title= "SMA")
p1 = plot(upper, color=color.blue,title= "UB")
p2 = plot(lower, color=color.blue,title= "LB")
fill(p1, p2)