概述
这个策略利用机器学习的方法,实现了一个开箱即用的自动化交易策略。它整合了多个指标和模型,可以自动生成交易信号,并根据信号进行买入和卖出操作。
策略原理
这个策略主要基于以下几个要点:
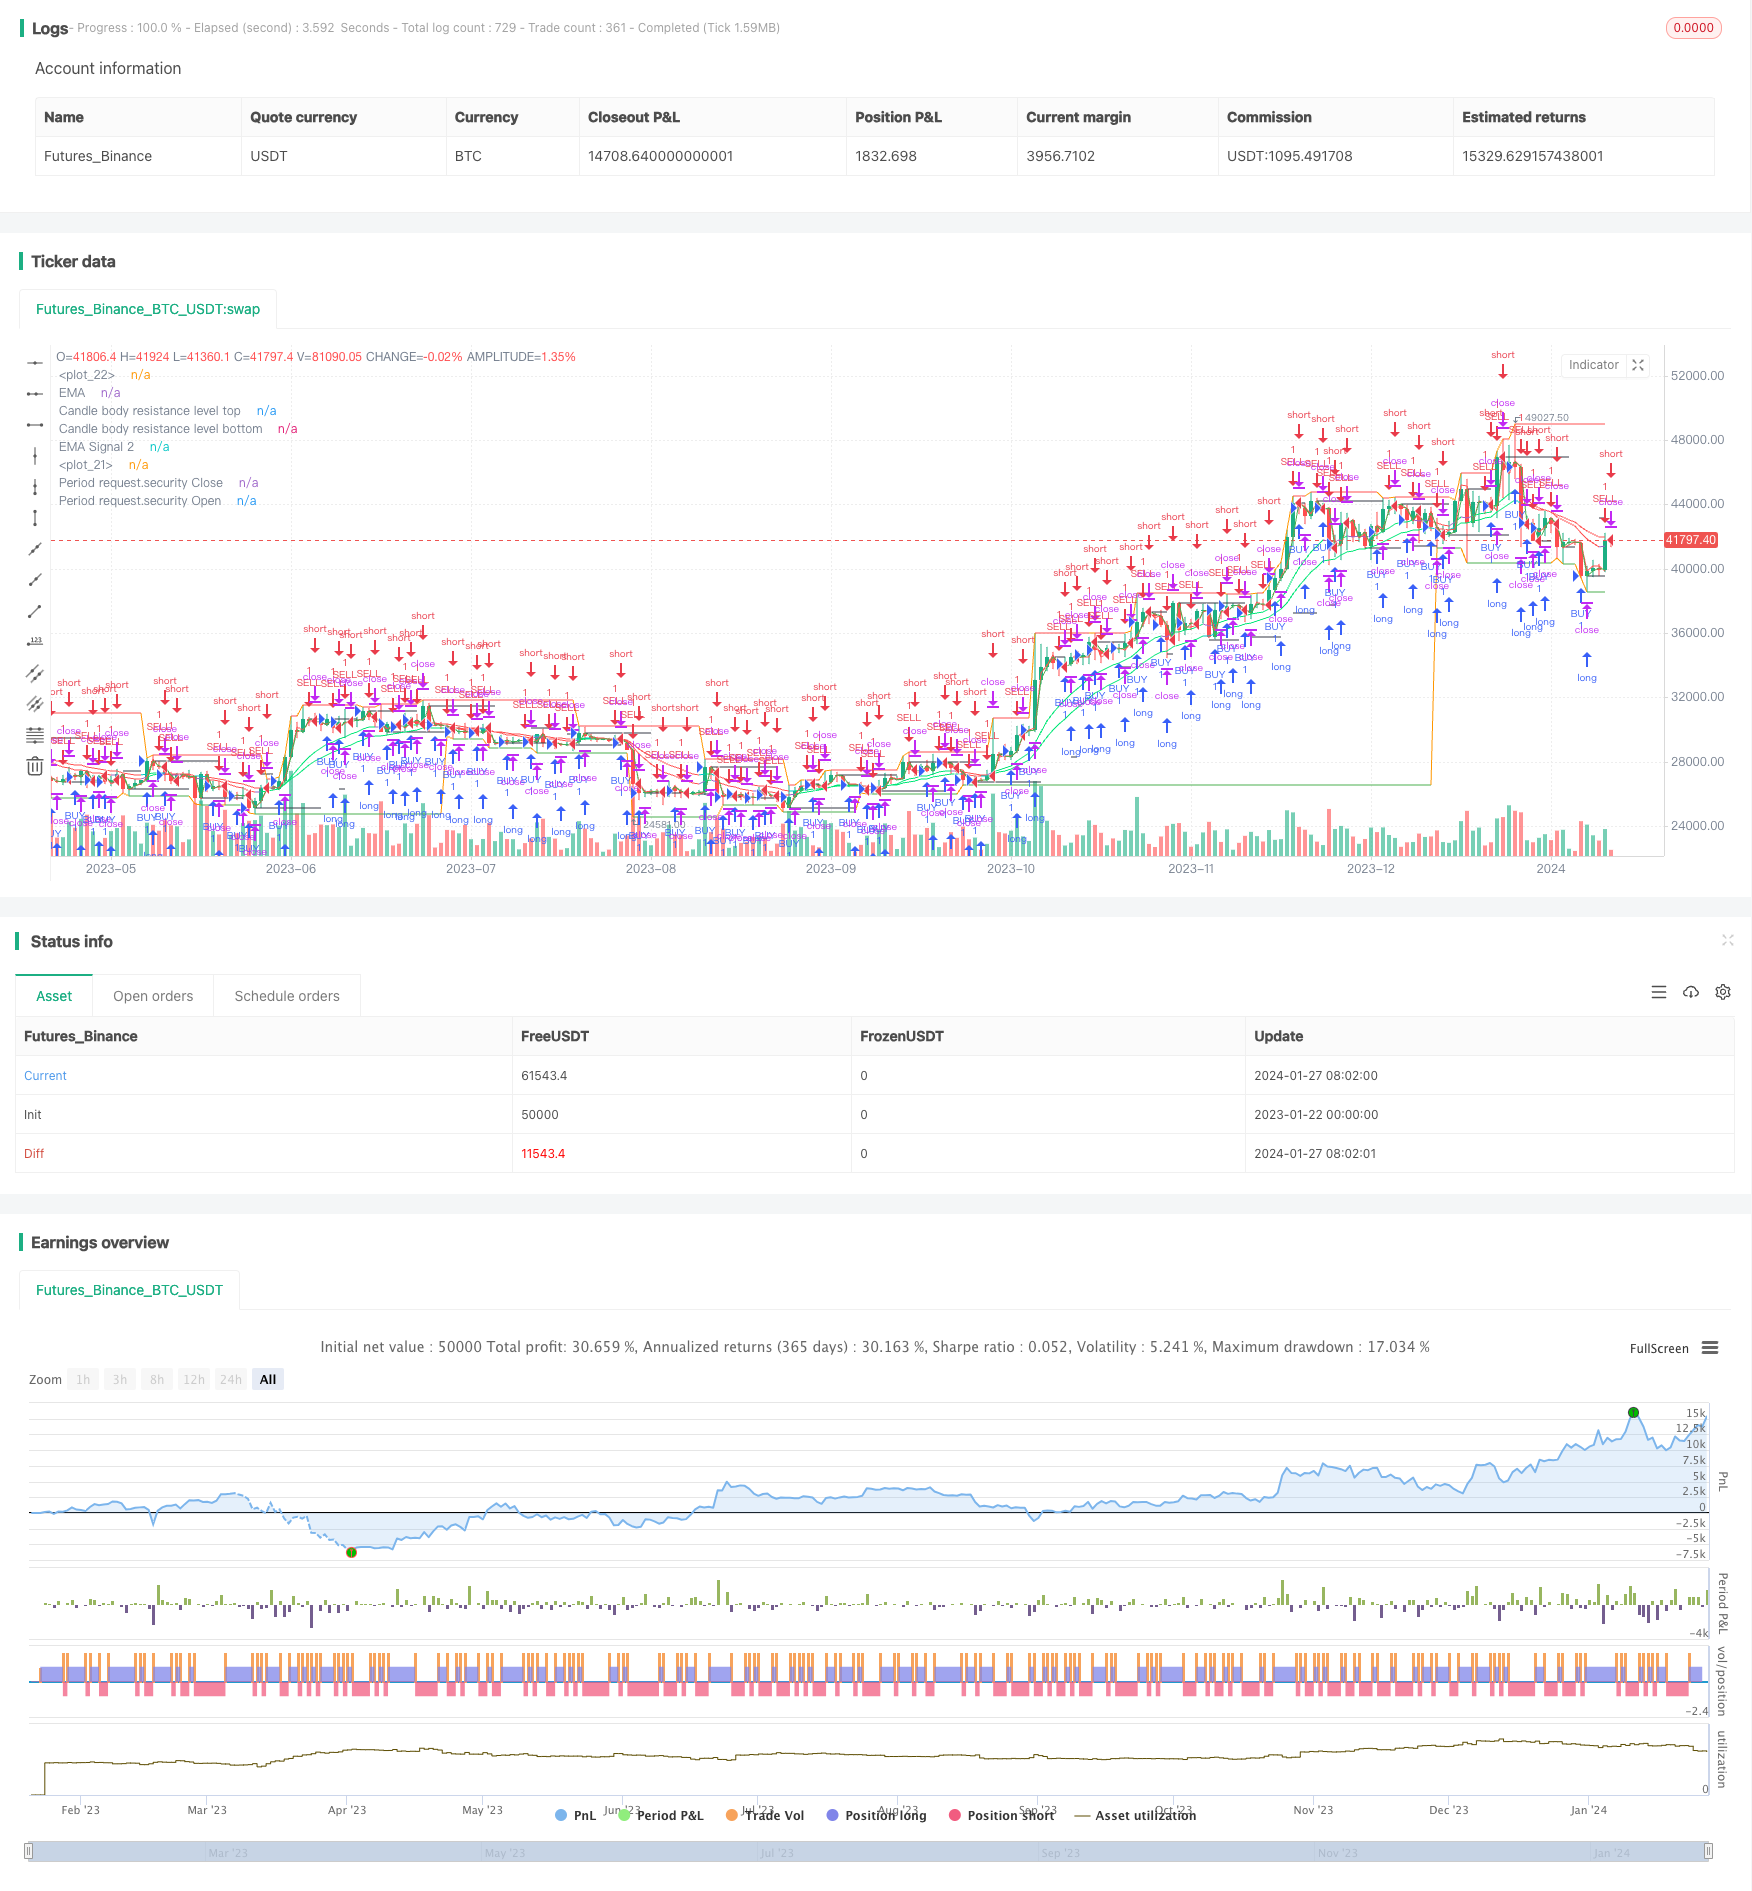
- 使用hull均线判断市场趋势方向
- 使用EMA判断短期和中期趋势
- 利用K线实体通道判断关键 SUPPORT/RESISTANCE 位置
- 利用多周期SECURITY开盘价和收盘价交叉做决策
具体来说,策略会绘制出hull均线、13周期EMA和21周期EMA。通过EMA的多空状态判断短期和中期趋势方向。再结合hull均线判断更长周期的趋势。这为后续交易信号提供了大方向的指引。
在调整仓位前,策略会参考实体通道内最高价和最低价对应的支撑和阻力位。这可以避免在关键价格区域产生交易信号。
最后,策略会调用60周期开盘价和收盘价,当收盘价上穿开盘价时产生买入信号,下穿时产生卖出信号。这样就完成了整个交易逻辑。
策略优势分析
这个策略最大的优势在于结合了机器学习和技术分析指标,实现了一个逻辑清晰、参数可调、易于操作的自动化交易方案。
- 多指标组合,提高信号准确性
策略没有单纯依赖一两个指标,而是综合考虑了趋势、支撑阻力、价格突破等多个因素,大大提高了信号的可靠性和准确性。
- 灵活的参数设置
hull均线长度、EMA周期数、开盘收盘交叉周期数都可以通过参数进行调整,使策略可以灵活适应不同市场环境。
- 自动化交易信号
基于指标和价格交叉的交易信号可以自动触发买入卖出,无需人工判断,降低了操作难度。
- 可视化的展示
策略中的图表可以清晰展示市场结构、趋势状态和关键价格,直观地显示策略判断依据。
风险分析
尽管这个策略进行了多方位优化,但仍有一些可能存在的风险:
- 大幅度行情无法跟踪
在价格剧烈波动的行情中,指标可能会失效或者延迟,导致策略无法及时跟踪价格变化。需要优化参数以适应这种行情。
- 信号误差率存在
基于指标和模型的交易信号,多多少少会存在一些误报或漏报的情况。这需要通过组合更多auxiliary signals来提高信号质量。
- 多空MIX风险
策略同时做多做空,如果判断错误,会面临双向亏损的风险。这需要严格的截断损失或降低仓位来控制。
- 过优化风险
参数设置过于复杂,会面临过优化的风险。这需要简化系统,控制参数组合数量。
策略优化方向
这个策略还有一定的优化空间,主要可以从以下几个方面进行:
- 添加更多指标信号
除了已有的指标,还可以引入更多辅助指标,如BOLL通道、KD指标等,丰富系统判断依据。
- 应用深度学习模型
将simple indicators作为特征,训练LSTM等深度学习模型,以提高信号质量。
- 结合基本面数据
添加宏观经济数据、政策面信息等基本面因素,优化大周期决策。
- 风险与仓位管理
引入止损策略,按照策略收益波动率动态调整仓位规模,严格控制风险。
总结
这个策略整合了趋势、支撑阻力、突破等多个指标,利用机器学习方法实现了自动化的开箱即用的量化交易方案。它有着指标组合多样、参数可调、信号自动化等优势,也面临一定的跟踪偏差、信号误差、多空MIX等问题。未来仍有引入更多辅助指标与模型、结合基本面因素、动态调整仓位等方向可以深入优化,从而达到更稳定、准确、智能的量化交易效果。
/*backtest
start: 2023-01-22 00:00:00
end: 2024-01-28 00:00:00
period: 1d
basePeriod: 1h
exchanges: [{"eid":"Futures_Binance","currency":"BTC_USDT"}]
*/

//@version=4
strategy(title='Ali Jitu Abus', shorttitle='Ali_Jitu_Abis_Strategy', overlay=true, pyramiding=0, initial_capital=1000, currency=currency.USD)

//Candle body resistance Channel-----------------------------//
len = 34
src = input(close, title="Candle body resistance channel")
out = sma(src, len)
last8h = highest(close, 13)
lastl8 = lowest(close, 13)
bearish = cross(close,out) == 1 and falling(close, 1)
bullish = cross(close,out) == 1 and rising(close, 1)
channel2=input(false, title="Bar Channel On/Off")
ul2=plot(channel2?last8h:last8h==nz(last8h[1])?last8h:na, color=black, linewidth=1, style=linebr, title="Candle body resistance level top", offset=0)
ll2=plot(channel2?lastl8:lastl8==nz(lastl8[1])?lastl8:na, color=black, linewidth=1, style=linebr, title="Candle body resistance level bottom", offset=0)
//fill(ul2, ll2, color=black, transp=95, title="Candle body resistance Channel")

//-----------------Support and Resistance
RST = input(title='Support / Resistance length:',  defval=10)
RSTT = valuewhen(high >= highest(high, RST), high, 0)
RSTB = valuewhen(low <= lowest(low, RST), low, 0)
RT2 = plot(RSTT, color=RSTT != RSTT[1] ? na : red, linewidth=1, offset=+0)
RB2 = plot(RSTB, color=RSTB != RSTB[1] ? na : green, linewidth=1, offset=0)

//--------------------Trend colour ema------------------------------------------------//
src0 = close, len0 = input(13, minval=1, title="EMA 1")
ema0 = ema(src0, len0)
direction = rising(ema0, 2) ? +1 : falling(ema0, 2) ? -1 : 0
plot_color = direction > 0  ? lime: direction < 0 ? red : na
plot(ema0, title="EMA", style=line, linewidth=1, color = plot_color)

//-------------------- ema 2------------------------------------------------//
src02 = close, len02 = input(21, minval=1, title="EMA 2")
ema02 = ema(src02, len02)
direction2 = rising(ema02, 2) ? +1 : falling(ema02, 2) ? -1 : 0
plot_color2 = direction2 > 0  ? lime: direction2 < 0 ? red : na
plot(ema02, title="EMA Signal 2", style=line, linewidth=1, color = plot_color2)

//=============Hull MA//
show_hma = input(false, title="Display Hull MA Set:")
hma_src = input(close, title="Hull MA's Source:")
hma_base_length = input(8, minval=1, title="Hull MA's Base Length:")
hma_length_scalar = input(5, minval=0, title="Hull MA's Length Scalar:")
hullma(src, length)=>wma(2*wma(src, length/2)-wma(src, length), round(sqrt(length)))
plot(not show_hma ? na : hullma(hma_src, hma_base_length+hma_length_scalar*6), color=black, linewidth=2, title="Hull MA")

//============ signal Generator ==================================//
Period=input('60')
ch1 = request.security(syminfo.tickerid, Period, open)
ch2 = request.security(syminfo.tickerid, Period, close)
longCondition = crossover(request.security(syminfo.tickerid, Period, close),request.security(syminfo.tickerid, Period, open))
if (longCondition)
    strategy.entry("BUY", strategy.long)
shortCondition = crossunder(request.security(syminfo.tickerid, Period, close),request.security(syminfo.tickerid, Period, open))
if (shortCondition)
    strategy.entry("SELL", strategy.short)

plot(request.security(syminfo.tickerid, Period, close), color=red, title="Period request.security Close")
plot(request.security(syminfo.tickerid, Period, open), color=green, title="Period request.security Open")

///////////////////////////////////////////////////////////////////////////////////////////