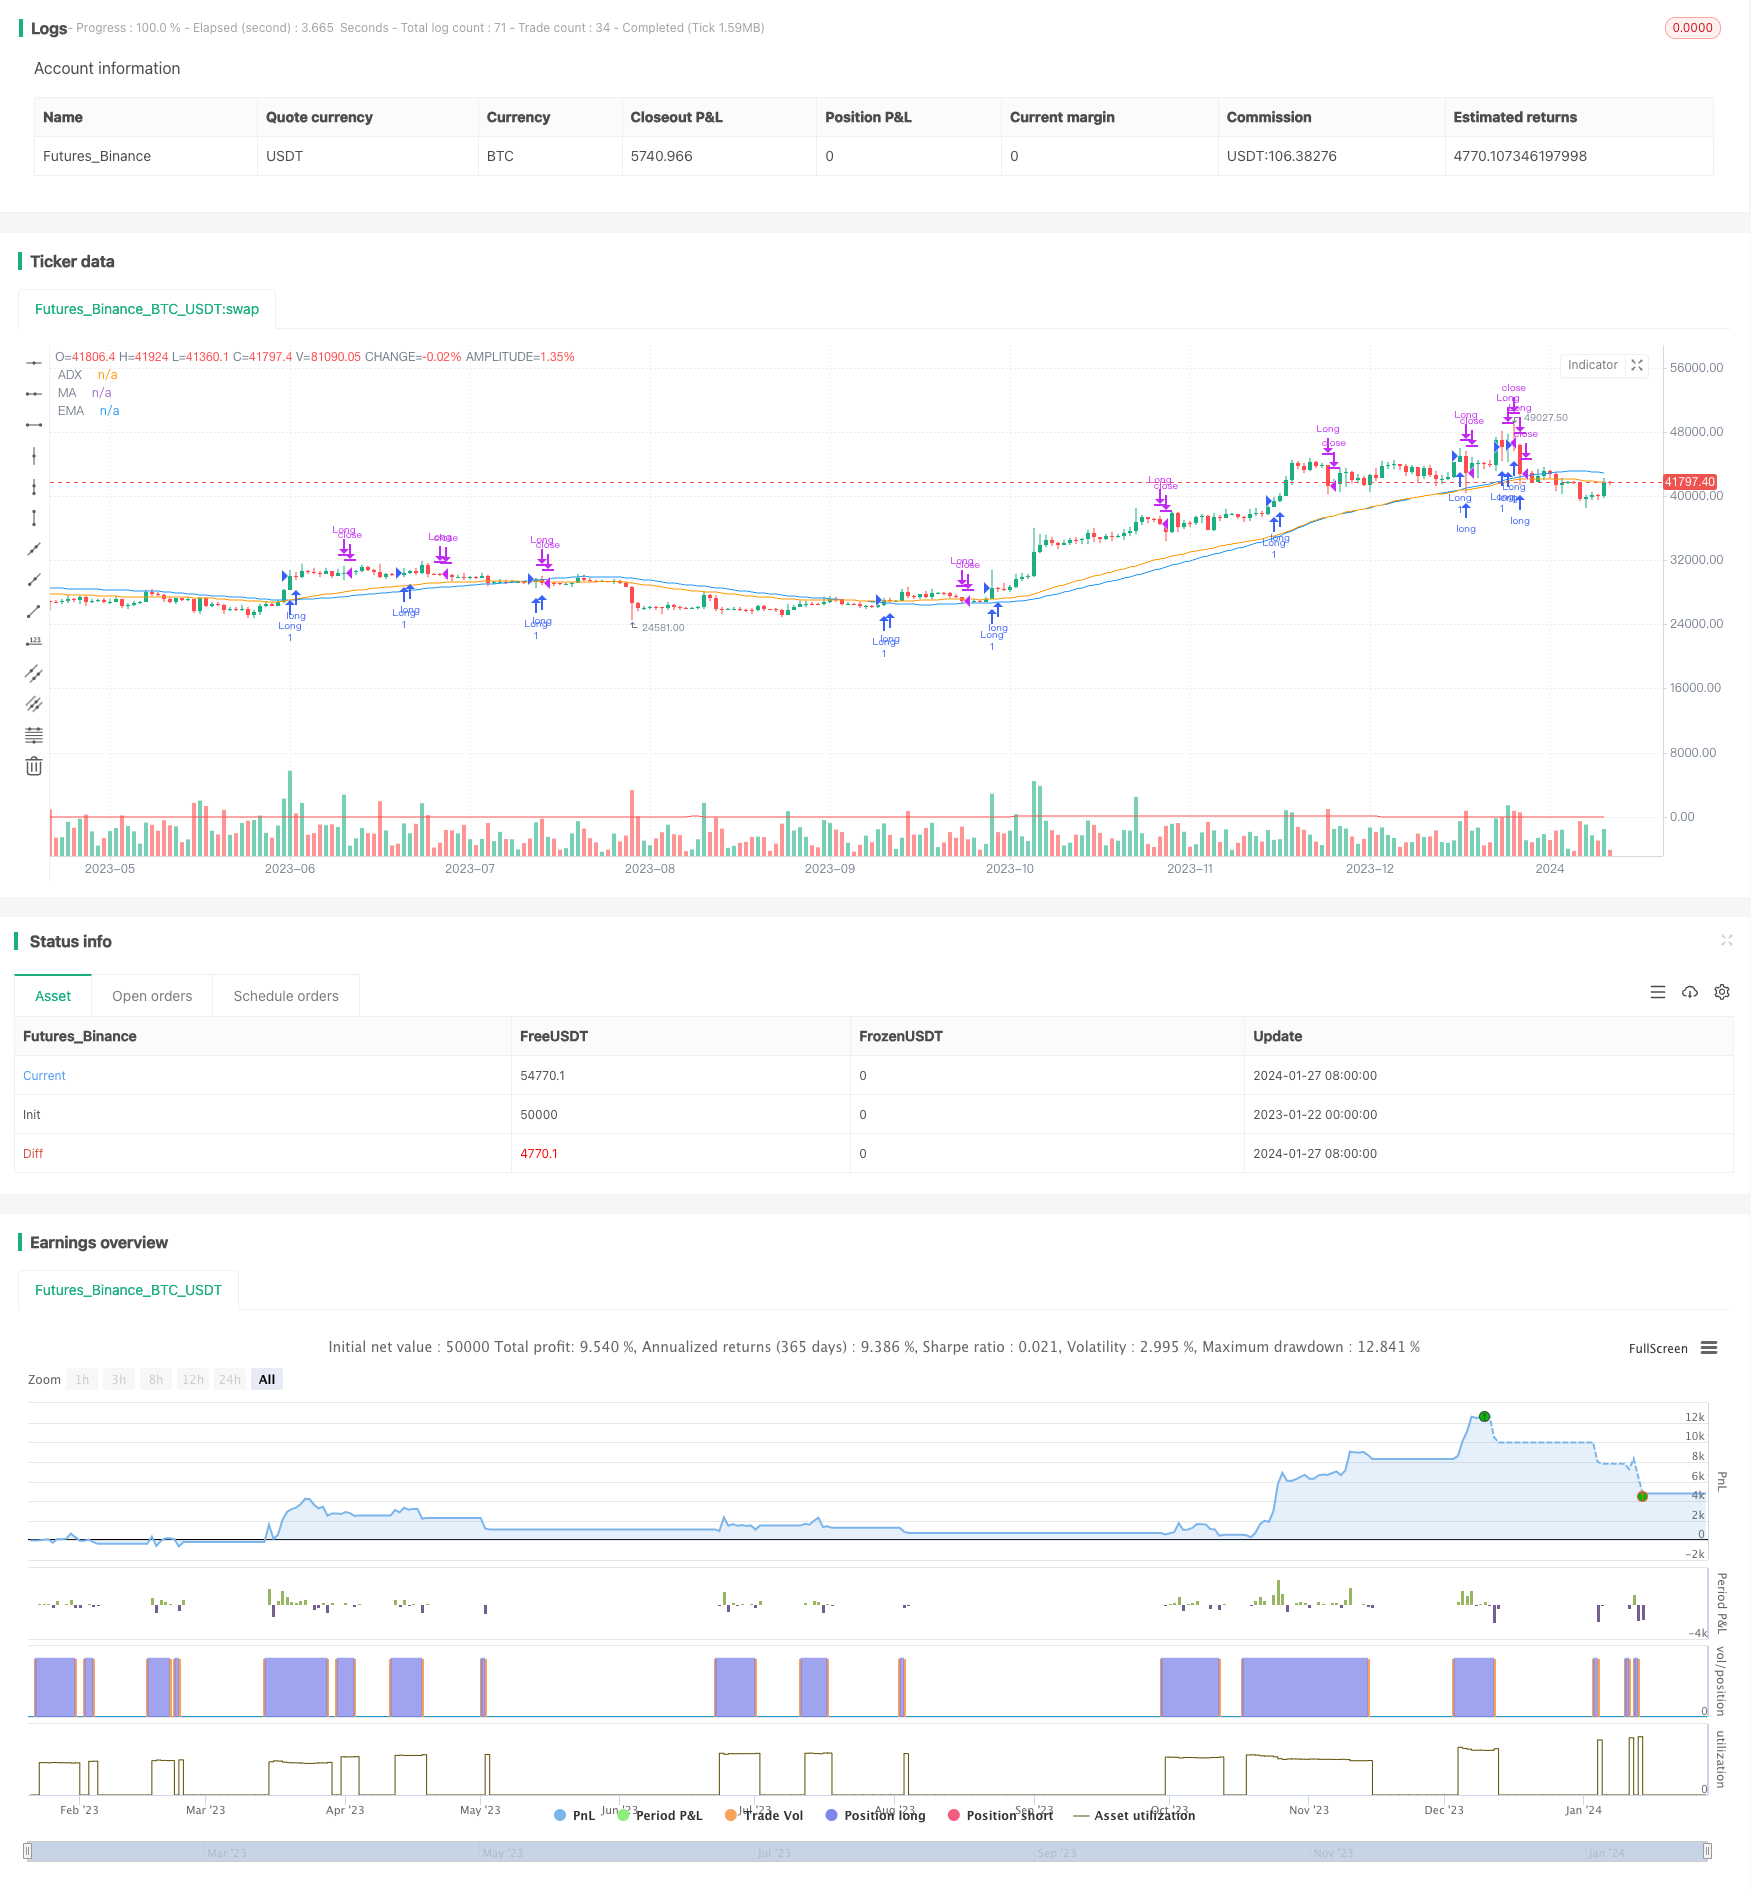
概述
这个策略主要是利用ADX指标判断趋势,并结合MA和EMA两种不同参数设置的移动平均线构建只做多的趋势跟踪策略。当ADX上涨时提示做多方向,并且价格突破上行MA和EMA时开仓做多;当ADX下跌或价格跌破MA或EMA其中之一时平仓。
策略原理
该策略主要利用ADX判断市场趋势和强度。ADX通过计算价格变化的程度和方向的程度来判断趋势的存在和强度。当ADX上涨时,说明目前处于一个上升趋势中;当ADX下跌时,说明趋势正在减弱。
该策略同时利用两种不同参数设置的移动平均线MA和EMA进行辅助判断。它们能有效地滤除价格的随机性,显示出价格的主要趋势方向。当价格上涨突破MA和EMA时,为做多信号;当价格下跌跌破时,为平仓信号。
结合ADX和移动平均线的特征,该策略构建了判断趋势方向的交易信号:ADX上涨且价格突破上行MA和EMA时做多开仓,ADX下跌或价格跌破MA/EMA时平仓,实现了一个只做多的趋势跟踪策略。
策略优势分析
该策略主要具有以下几个优势:
- 利用ADX判断趋势强度,能减少无效交易的发生,跟踪趋势;
- 结合两种不同参数设置的移动平均线进行过滤,能有效识别趋势;
- 只做多,避免29797频繁反向操作带来的滑点损失;
- 入场条件严格,能有效控制风险;
- 实现了一个只做多的长线趋势跟踪策略。
策略风险分析
该策略也存在一些风险:
- ADX指标存在滞后,可能错过最佳入场时机;
- 只做多,无法利用下跌行情获利;
- 当趋势发生转变时,存在一定亏损风险;
- 参数设置不当也会影响策略表现。
对应解决方法:
- 适当调整ADX的参数,减少滞后;
- 可设置止损策略,控制单笔亏损;
- 对参数进行测试优化,选择最佳参数。
策略优化方向
该策略还可以从以下几个方面进行优化:
- 增加止损策略,更好控制风险;
- 增加仓位管理,根据市场情况动态调整仓位;
- 测试优化参数,寻找最佳参数组合;
- 增加机器学习算法,动态优化参数;
- 构建马丁格尔做多策略,降低盈亏比的影响。
总结
该策略整体是一个利用ADX判断趋势强度,并辅助以两个移动平均线构建过滤信号的只做多趋势跟踪策略。它有效控制了无效交易的发生,实现了跟踪趋势的效果,是一种较为稳定的只做多策略。通过一定的优化调整,可以进一步增强策略的稳定性和收益率。
策略源码
/*backtest
start: 2023-01-22 00:00:00
end: 2024-01-28 00:00:00
period: 1d
basePeriod: 1h
exchanges: [{"eid":"Futures_Binance","currency":"BTC_USDT"}]
*/

//@version=4
strategy("ADX, MA, and EMA Long Strategy - ADX Trending Up", shorttitle="ADX_MA_EMA_Long_UpTrend", overlay=true)
adxlen = input(14, title="ADX Smoothing")
dilen = input(14, title="DI Length")
maPeriod = input(50, title="MA Period")
emaPeriod = input(50, title="EMA Period")
dirmov(len) =>
    up = change(high)
    down = -change(low)
    plusDM = na(up) ? na : (up > down and up > 0 ? up : 0)
    minusDM = na(down) ? na : (down > up and down > 0 ? down : 0)
    truerange = rma(tr, len)
    plus = fixnan(100 * rma(plusDM, len) / truerange)
    minus = fixnan(100 * rma(minusDM, len) / truerange)
    [plus, minus]
adx(dilen, adxlen) =>
    [plus, minus] = dirmov(dilen)
    sum = plus + minus
    100 * rma(abs(plus - minus) / (sum == 0 ? 1 : sum), adxlen)
sig = adx(dilen, adxlen)
maValue = sma(close, maPeriod)
emaValue = ema(close, emaPeriod)
longCondition = sig > sig[1] and close > maValue and close > emaValue
if (longCondition)
    strategy.entry("Long", strategy.long)
exitCondition = sig < sig[1] or  close < maValue or close < emaValue
if (exitCondition)
    strategy.close("Long")
plot(maValue, color=color.blue, title="MA")
plot(emaValue, color=color.orange, title="EMA")
plot(sig, color=color.red, title="ADX")