概述
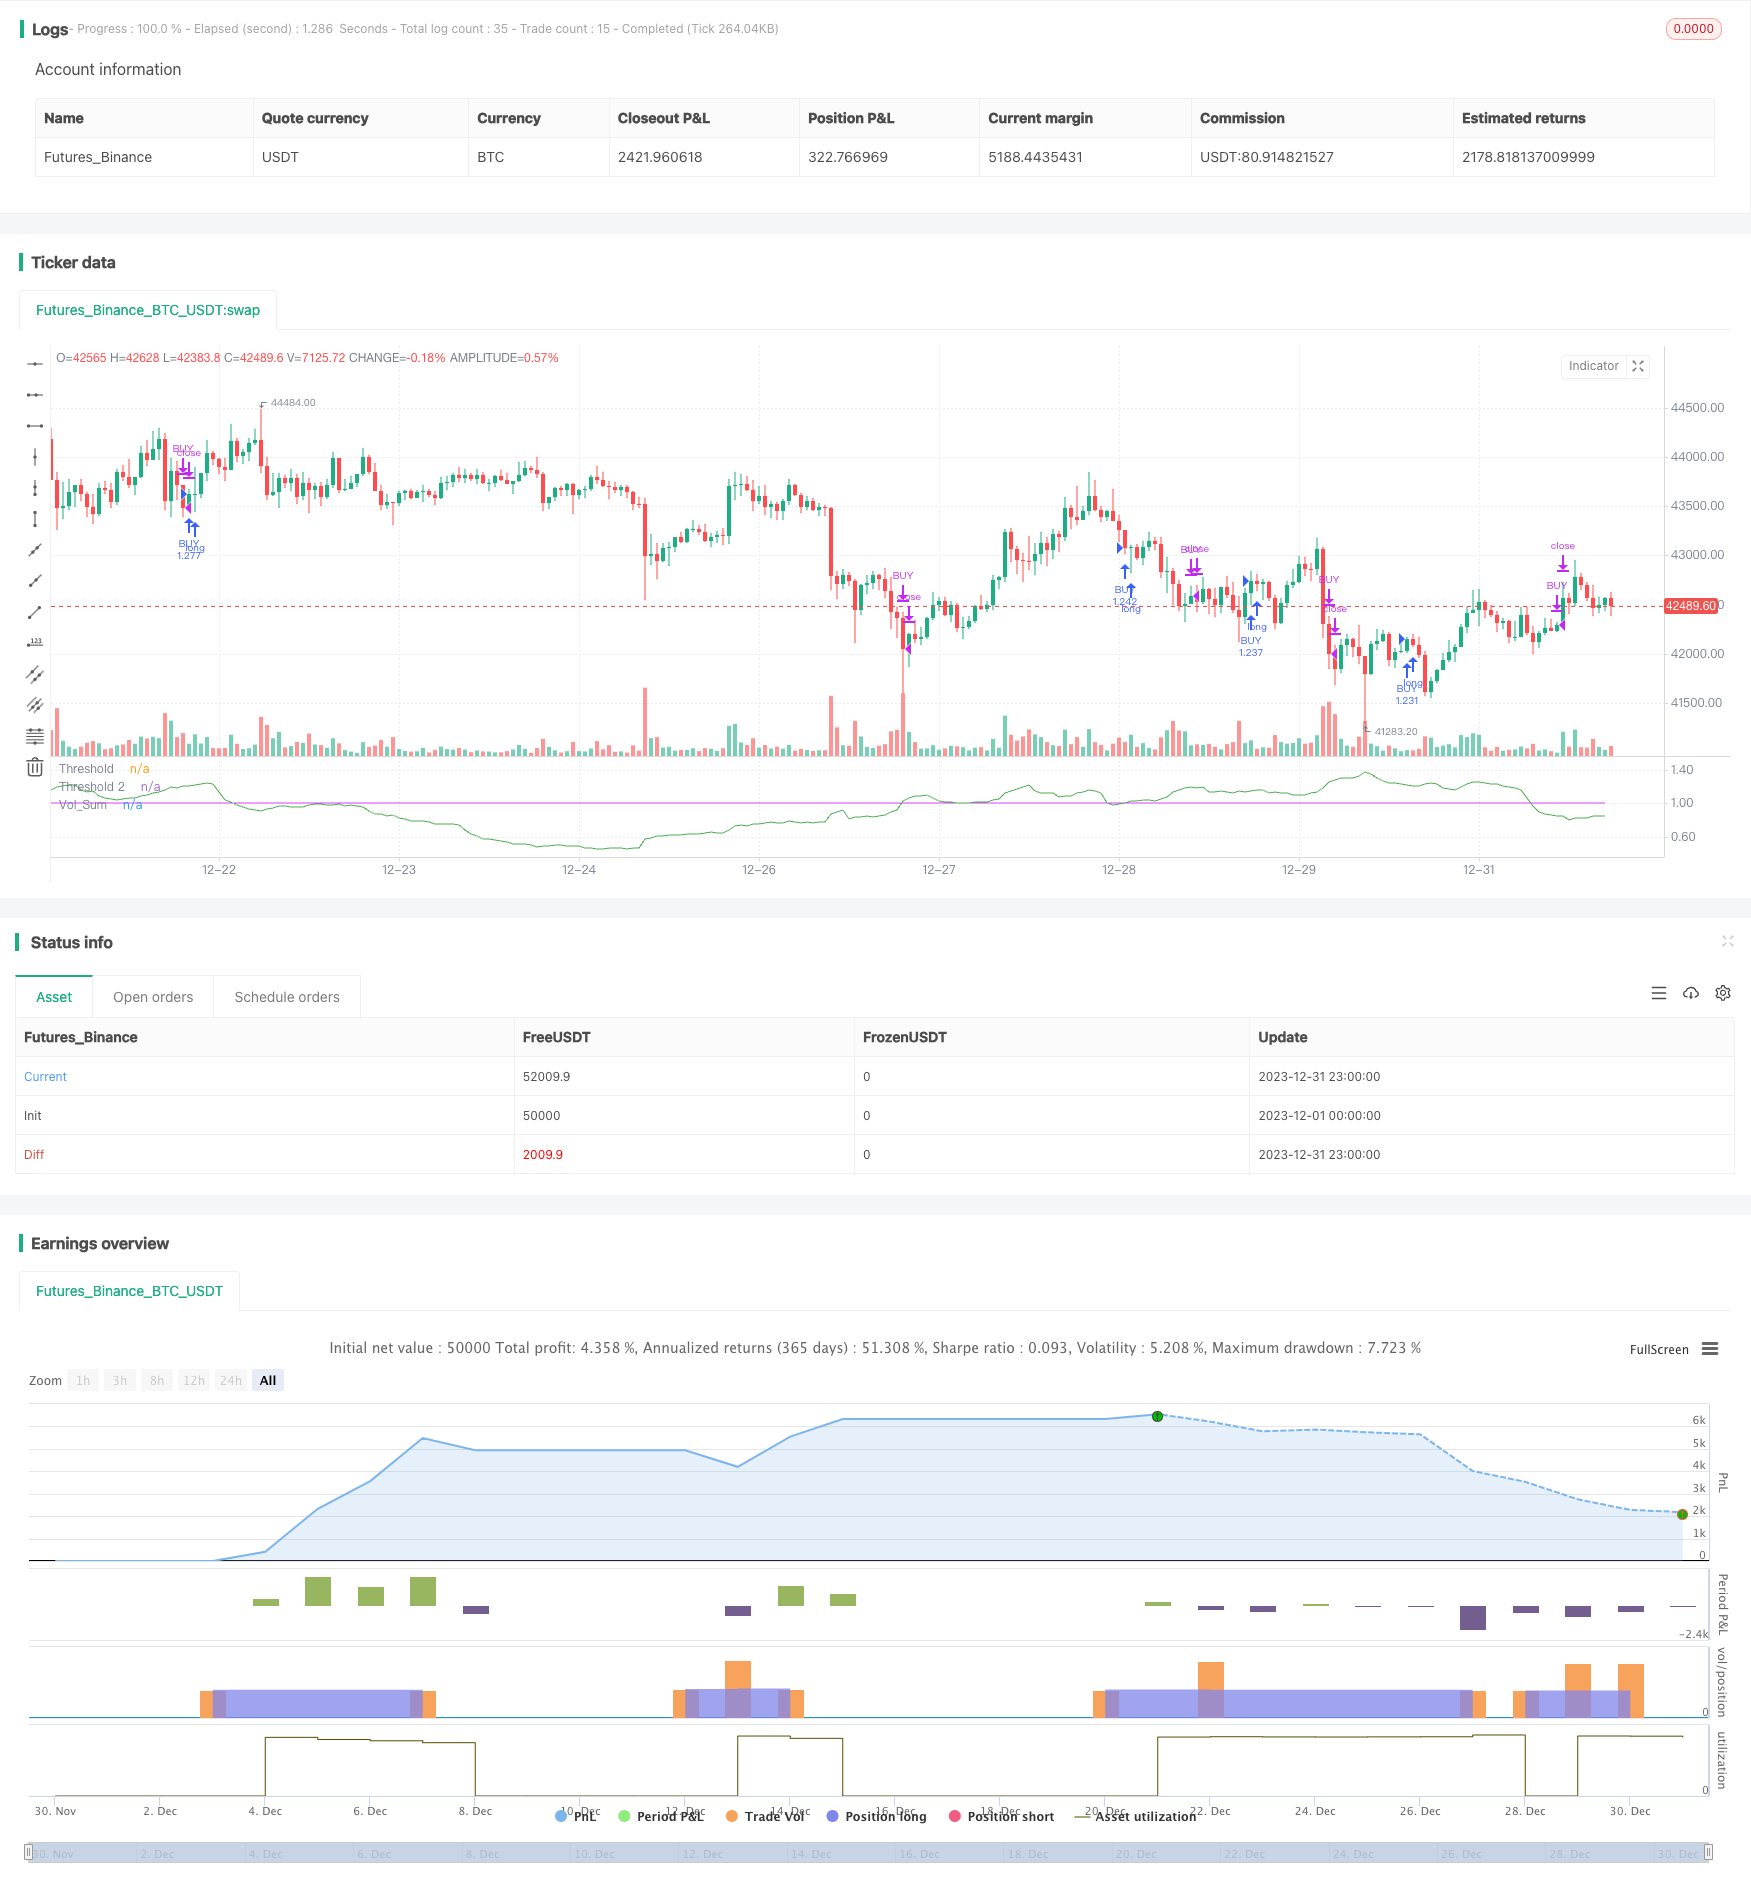
本策略是基于修改后的成交量震荡器指标进行交易的趋势跟踪策略。它利用成交量的均线,识别成交量增加的 Signals,从而判断进入或退出仓位。同时结合价格本身的趋势判断,避免在价格震荡时产生错误Signals。
策略原理
- 计算成交量的均线vol_sum,长度为vol_length,进行vol_smooth长度的均线平滑。
- 当vol_sum上涨超过阈值threshold时产生买入Signal,下跌超过阈值时产生卖出Signal。
- 为过滤误操作,仅当与过去direction根K线的收盘价进行比较,价格趋势上涨时,才进行买入操作。价格趋势下跌时,才进行卖出操作。
- 设置两个阈值threshold和threshold2。threshold用来产生交易Signal,threshold2用来止损。
- 通过状态机管理订单的开平仓逻辑。
优势分析
- 使用成交量指标,可以捕捉市场买卖力道的变化,从而提高信号的准确性。
- 结合价格趋势判断,可以避免在价格震荡的时候产生错误信号。
- 使用两个阈值进行开仓和止损,可以更好控制风险。
风险分析
- 成交量指标本身会有滞后,可能会错过价格转折点。
- 错误的参数设置会导致交易频率过高或信号产生滞后。
- 在成交量激增的场景下,止损点可能会被突破。
可以通过调整参数,优化指标计算方式,结合其他指标进行确认来控制这些风险。
优化方向
- 可以考虑将指标参数进行自适应优化,根据市场情况自动调整。
- 可以结合其他指标,例如价格震荡指数,进一步验证信号以提高准确率。
- 可以研究将机器学习模型运用到信号判断中,利用模型判断提高准确性。
总结
本策略通过改进后的成交量震荡器,辅助以价格趋势判断,设立两个阈值进行开仓和止损,整体是一个较为稳定的趋势跟踪策略。优化空间主要在参数调整、信号过滤以及止损策略方面。总的来说,该策略有一定的实用价值,值得进一步研究优化。
策略源码
/*backtest
start: 2023-12-01 00:00:00
end: 2023-12-31 23:59:59
period: 1h
basePeriod: 15m
exchanges: [{"eid":"Futures_Binance","currency":"BTC_USDT"}]
*/

//@version=4
strategy('Volume Advanced', default_qty_type=strategy.percent_of_equity, default_qty_value=100, commission_type=strategy.commission.percent, commission_value=0.075, currency='USD')
startP = timestamp(input(2017, "Start Year"), input(12, "Start Month"), input(17, "Start Day"), 0, 0)
end    = timestamp(input(9999, "End Year"),   input(1, "End Month"),   input(1, "End Day"),   0, 0)
_testPeriod() =>
    iff(time >= startP and time <= end, true, false)

source = close
vol_length  = input(34, title = "Volume - Length")
vol_smooth  = input(200,title = "Volume - Smoothing")
volriselen  = input(21,  title = "Volume - Risinglength")
volfalllen  = input(13, title = "Volume - Fallinglength")
threshold   = input(1,"threshold")
threshold2  = input(1.2,step=0.1, title="Threshold 2")
direction = input(13,"amount of bars")


volsum  = sum(volume, vol_length) / (sum(volume, vol_smooth) / (vol_smooth / vol_length))


LongEntry  = (rising(volsum, volriselen) or crossover (volsum, threshold)) and close > close[direction]
ShortEntry = (rising(volsum, volriselen) or crossover (volsum, threshold)) and close < close[direction]
LongExit1  = falling (volsum,volfalllen)
ShortExit1 = falling (volsum,volfalllen)
LongExit2= (crossover(volsum, threshold2) and close < close[direction])


_state = 0
_prev = nz(_state[1])
_state := _prev

if _prev == 0
    if LongEntry
        _state := 1
        _state
    if ShortEntry
        _state := 2
        _state
if _prev == 1
    if ShortEntry or LongExit1
        _state := 0
        _state
if _prev == 2
    if LongEntry or ShortExit1
        _state := 0
        _state

_bLongEntry = _state == 1
_bLongClose = _state == 0

long_condition = _bLongEntry and close > close[direction]
strategy.entry('BUY', strategy.long, when=long_condition)

short_condition =  _bLongClose or LongExit2
strategy.close('BUY', when=short_condition)

plot(volsum,      color = color.green,    title="Vol_Sum")
plot(threshold, color = color.fuchsia, transp=50, title="Threshold")
plot(threshold2, color=color.white, transp = 50, title="Threshold 2")