概述
这是一个结合使用Bill Williams的分形理论和ZZ指标的量化交易策略。该策略通过计算威廉姆斯分形来判断市场趋势,并结合ZZ指标绘制支撑阻力线,以发现潜在的突破点,从而实现趋势跟踪交易。
策略原理
该策略首先计算威廉姆斯分形,判断当前是上涨分形还是下跌分形。如果是上涨分形,则认为目前处于上涨趋势;如果是下跌分形,则认为目前处于下跌趋势。
然后根据分形点绘制ZZ指标的支撑线和阻力线。如果价格突破上涨分形对应的阻力线,则做多;如果价格突破下跌分形对应的支撑线,则做空。
通过这样的组合,可以在趋势发生转变的时候及时捕捉,实现趋势跟踪交易。
策略优势分析
这种策略结合使用了威廉姆斯分形和ZZ指标两种不同的技术分析方法,以发掘更多的交易机会。
它能够及时判断市场趋势的转变,并设置好的止损止盈条件,有助于把握主要趋势的方向。此外,ZZ指标可以过滤掉部分假突破的情况,避免不必要的损失。
总的来说,这种策略既考虑了趋势判断,也考虑了具体的入场点选择,做到了风险和收益的平衡。
策略风险分析
这种策略最大的风险在于分形判断和ZZ指标可能会发出错误的交易信号,导致不必要的亏损。例如,突破阻力线后,价格可能会很快回落,无法持续上涨。
此外,分形的计算方式可能因为时间周期设置不当而判断失误。如果时间周期太短,则会增加假突破的概率。
要降低这些风险,可以适当调整分形的计算参数,也可以通过增加过滤条件来减少错误信号。此外,可以设置较大的止损幅度,以控制单笔损失。
策略优化方向
这种策略可以通过以下几个方面来进行进一步优化:
增加动量指标过滤,例如MACD或者布林带指标,可以避免部分假突破。
优化分形参数设置,调整对高低点的计算方式,缩小时间周期,以获得更准确的趋势判断。
增加机器学习算法判断趋势准确性,利用AI判断力避免人工设置的局限性。
增加自适应止损机制,可以根据市场波动程度来调整止损幅度。
利用深度学习算法来优化整体参数设置。
总结
本策略通过威廉姆斯分形理论和ZZ指标的巧妙结合,实现了对市场趋势变化的及时判断和捕捉。它保持了较高的胜率,有望获得长期稳定的超额收益。下一步通过引入更多过滤手段和AI判断力,有望进一步提高策略的稳定性和收益率。
/*backtest
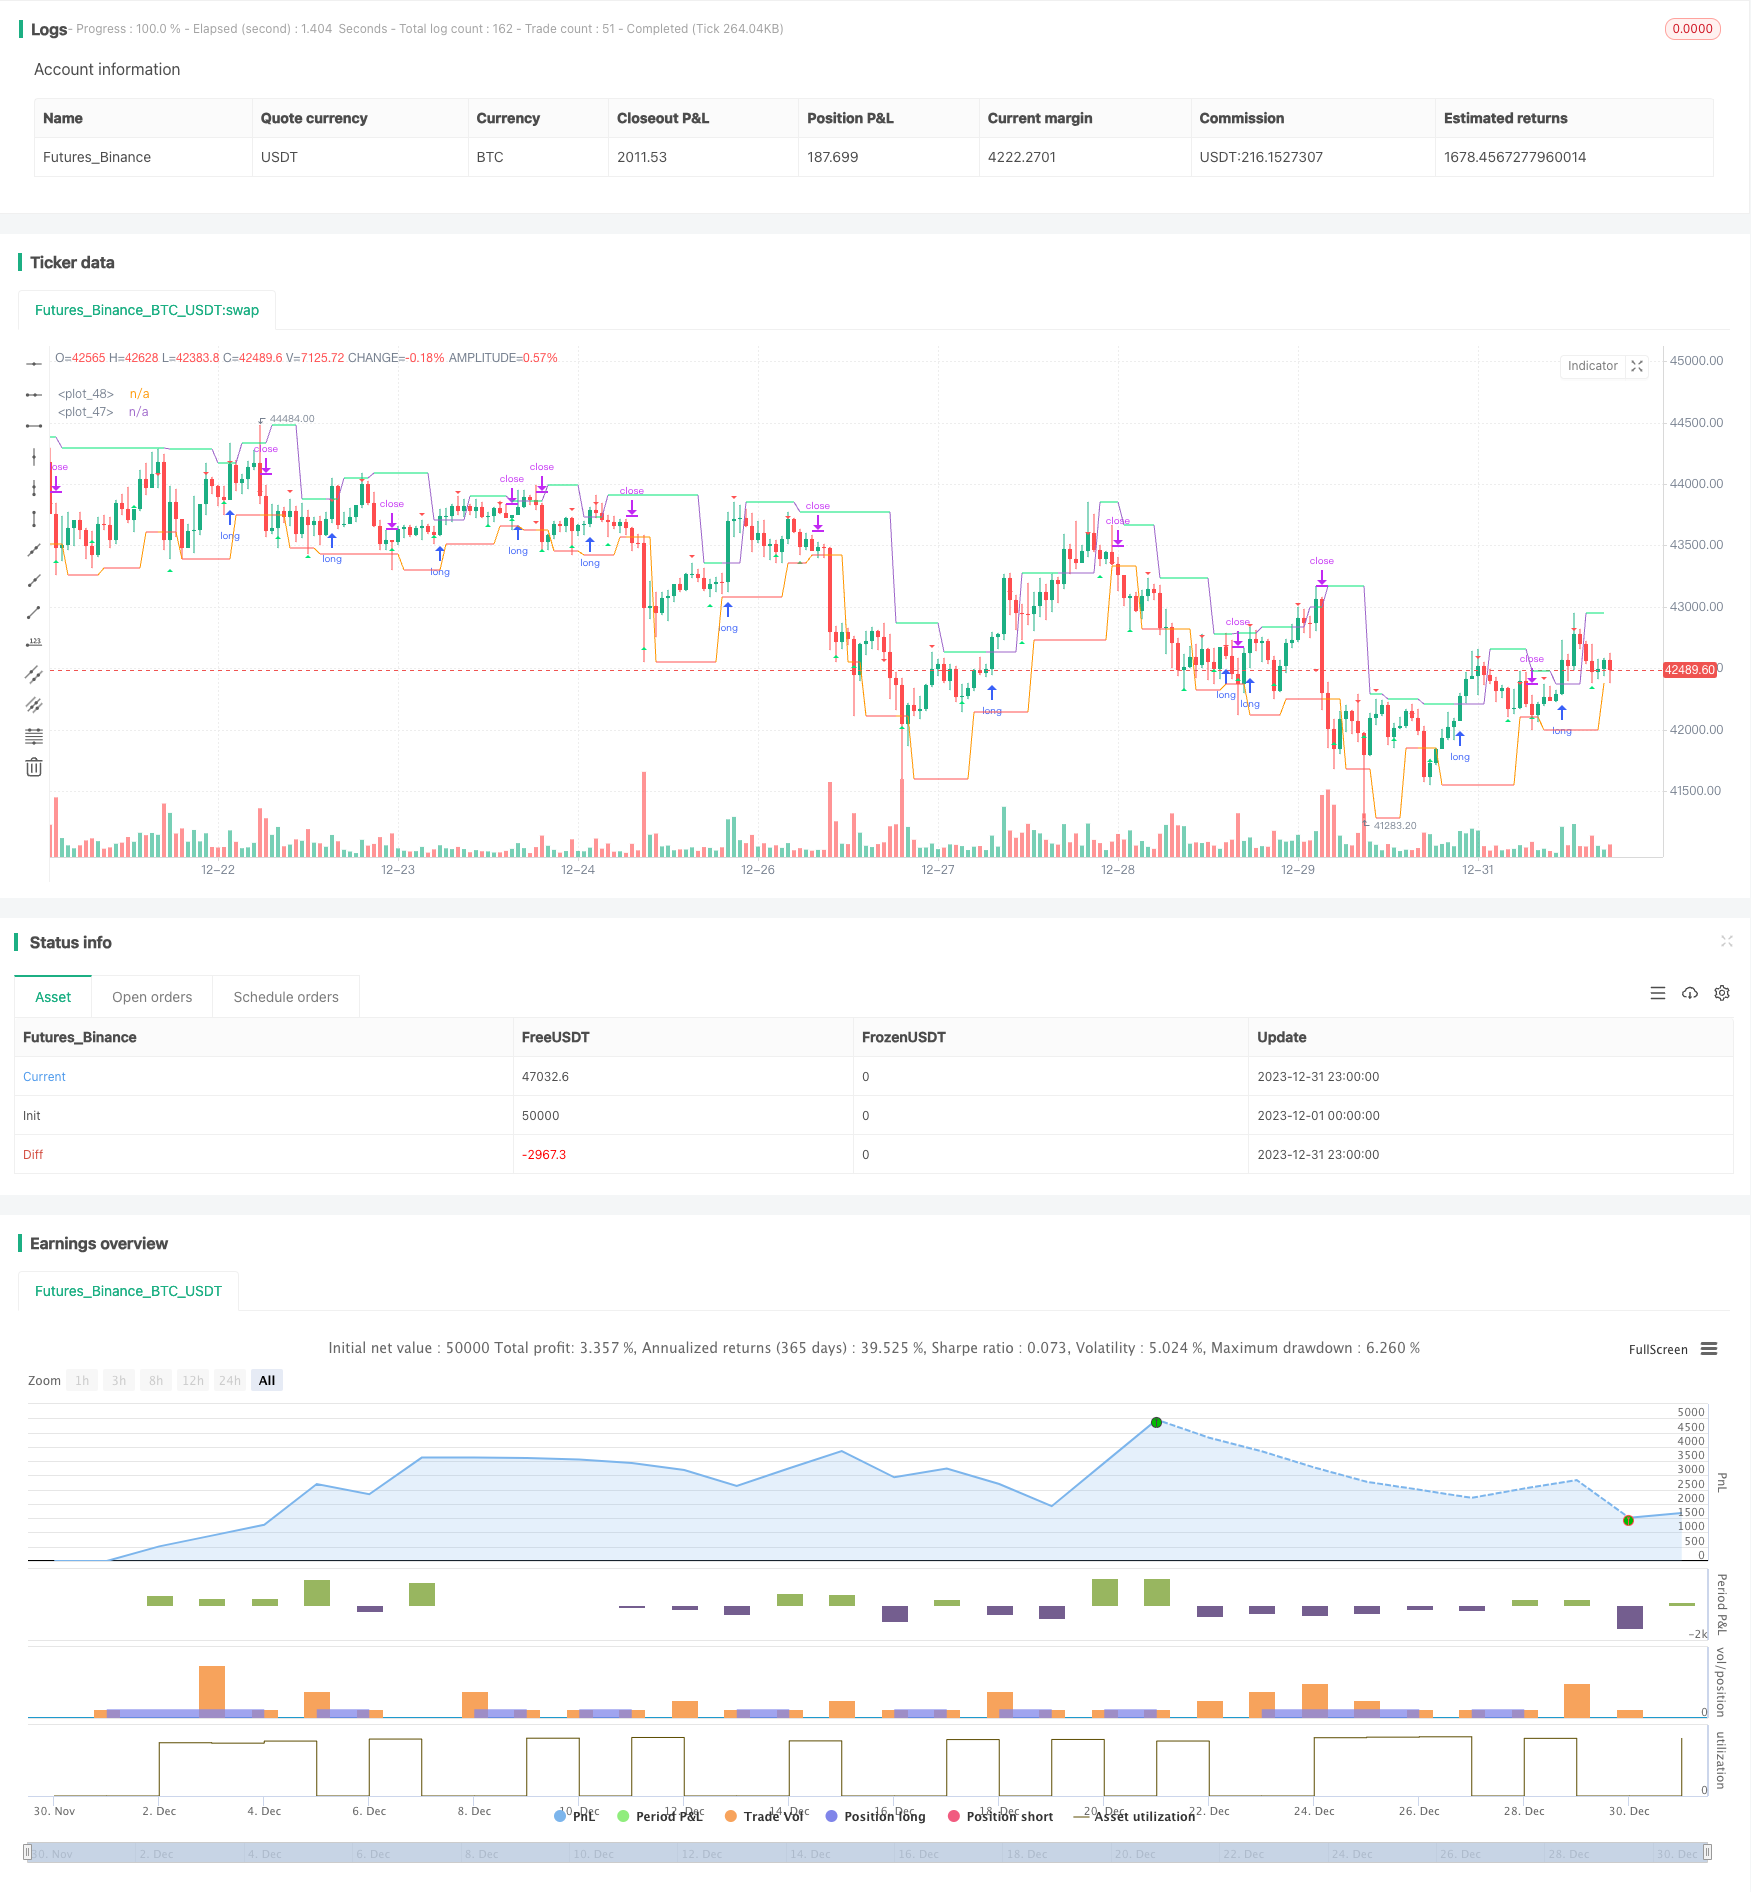
start: 2023-12-01 00:00:00
end: 2023-12-31 23:59:59
period: 1h
basePeriod: 15m
exchanges: [{"eid":"Futures_Binance","currency":"BTC_USDT"}]
*/
//@version=4
strategy(title = "robotrading ZZ-8 fractals", shorttitle = "ZZ-8", overlay = true, default_qty_type = strategy.percent_of_equity, initial_capital = 100, default_qty_value = 100, commission_value = 0.1)
//Settings
needlong = input(true, defval = true, title = "Long")
needshort = input(false, defval = true, title = "Short")
filterBW = input(false, title="filter Bill Williams Fractals")
showll = input(true, title = "Show levels")
showff = input(true, title = "Show fractals (repaint!)")
showdd = input(true, title = "Show dots (repaint!)")
showbg = input(false, title = "Show background")
showlb = input(false, title = "Show drawdown")
startTime = input(defval = timestamp("01 Jan 2000 00:00 +0000"), title = "Start Time", type = input.time, inline = "time1")
finalTime = input(defval = timestamp("31 Dec 2099 23:59 +0000"), title = "Final Time", type = input.time, inline = "time1")
//Variables
loss = 0.0
maxloss = 0.0
equity = 0.0
truetime = true
//Fractals
isRegularFractal(mode) =>
ret = mode == 1 ? high[4] < high[3] and high[3] < high[2] and high[2] > high[1] and high[1] > high[0] : mode == -1 ? low[4] > low[3] and low[3] > low[2] and low[2] < low[1] and low[1] < low[0] : false
isBWFractal(mode) =>
ret = mode == 1 ? high[4] < high[2] and high[3] <= high[2] and high[2] >= high[1] and high[2] > high[0] : mode == -1 ? low[4] > low[2] and low[3] >= low[2] and low[2] <= low[1] and low[2] < low[0] : false
filteredtopf = filterBW ? isRegularFractal(1) : isBWFractal(1)
filteredbotf = filterBW ? isRegularFractal(-1) : isBWFractal(-1)
//Triangles
plotshape(filteredtopf and showff, title='Filtered Top Fractals', style=shape.triangledown, location=location.abovebar, color= color.red, offset=-2)
plotshape(filteredbotf and showff, title='Filtered Bottom Fractals', style=shape.triangleup, location=location.belowbar, color= color.lime, offset=-2)
//Levels
hh = 0.0
ll = 0.0
hh := filteredtopf ? high[2] : hh[1]
ll := filteredbotf ? low[2] : ll[1]
//Trend
trend = 0
trend := high >= hh[1] ? 1 : low <= ll[1] ? -1 : trend[1]
//Lines
hcol = showll and hh == hh[1] and close < hh ? color.lime : na
lcol = showll and ll == ll[1] and close > ll ? color.red : na
plot(hh, color = hcol)
plot(ll, color = lcol)
//Dots
// var line hline = na
// if hh != hh[1] and showdd
// hline := line.new(bar_index - 0, hh[0], bar_index - 2, hh[0], xloc = xloc.bar_index, extend = extend.none, style = line.style_dotted, color = color.lime, width = 1)
// var line lline = na
// if ll != ll[1] and showdd
// lline := line.new(bar_index - 0, ll[0] - syminfo.mintick, bar_index - 2, ll[0] - syminfo.mintick, xloc = xloc.bar_index, extend = extend.none, style = line.style_dotted, color = color.red, width = 1)
//Background
bgcol = showbg == false ? na : trend == 1 ? color.lime : trend == -1 ? color.red : na
bgcolor(bgcol, transp = 80)
//Orders
if hh > 0 and needlong
strategy.entry("Long", strategy.long, na, stop = hh, when = needlong and truetime)
strategy.exit("Exit Long", "Long", stop = ll, when = needshort == false)
if ll > 0 and startTime
strategy.entry("Short", strategy.short, na, stop = ll, when = needshort and truetime)
strategy.exit("Exit Short", "Short", stop = hh, when = needlong == false)
if time > finalTime
strategy.close_all()
strategy.cancel("Long")
strategy.cancel("Short")
if showlb
//Drawdown
max = 0.0
max := max(strategy.equity, nz(max[1]))
dd = (strategy.equity / max - 1) * 100
min = 100.0
min := min(dd, nz(min[1]))
//Max loss size
equity := strategy.position_size != strategy.position_size[1] ? strategy.equity : equity[1]
loss := equity < equity[1] ? ((equity / equity[1]) - 1) * 100 : 0
maxloss := min(nz(maxloss[1]), loss)
//Label
min := round(min * 100) / 100
maxloss := round(maxloss * 100) / 100
labeltext = "Drawdown: " + tostring(min) + "%" + "\nMax.loss " + tostring(maxloss) + "%"
var label la = na
label.delete(la)
tc = min > -100 ? color.white : color.red
osx = timenow + round(change(time)*50)
osy = highest(100)
la := label.new(x = osx, y = osy, text = labeltext, xloc = xloc.bar_time, yloc = yloc.price, color = color.black, style = label.style_labelup, textcolor = tc)