Commodity Channel Index Reversal Trading Strategy

Overview
This strategy identifies the cyclical and seasonal characteristics in the market based on the Commodity Channel Index (CCI) to detect the start and end of cycles. It forms the final index by incorporating a moving average and divisor that reflects both possible and actual trading ranges to measure deviations from normal levels, indicating major trend changes.
Strategy Logic
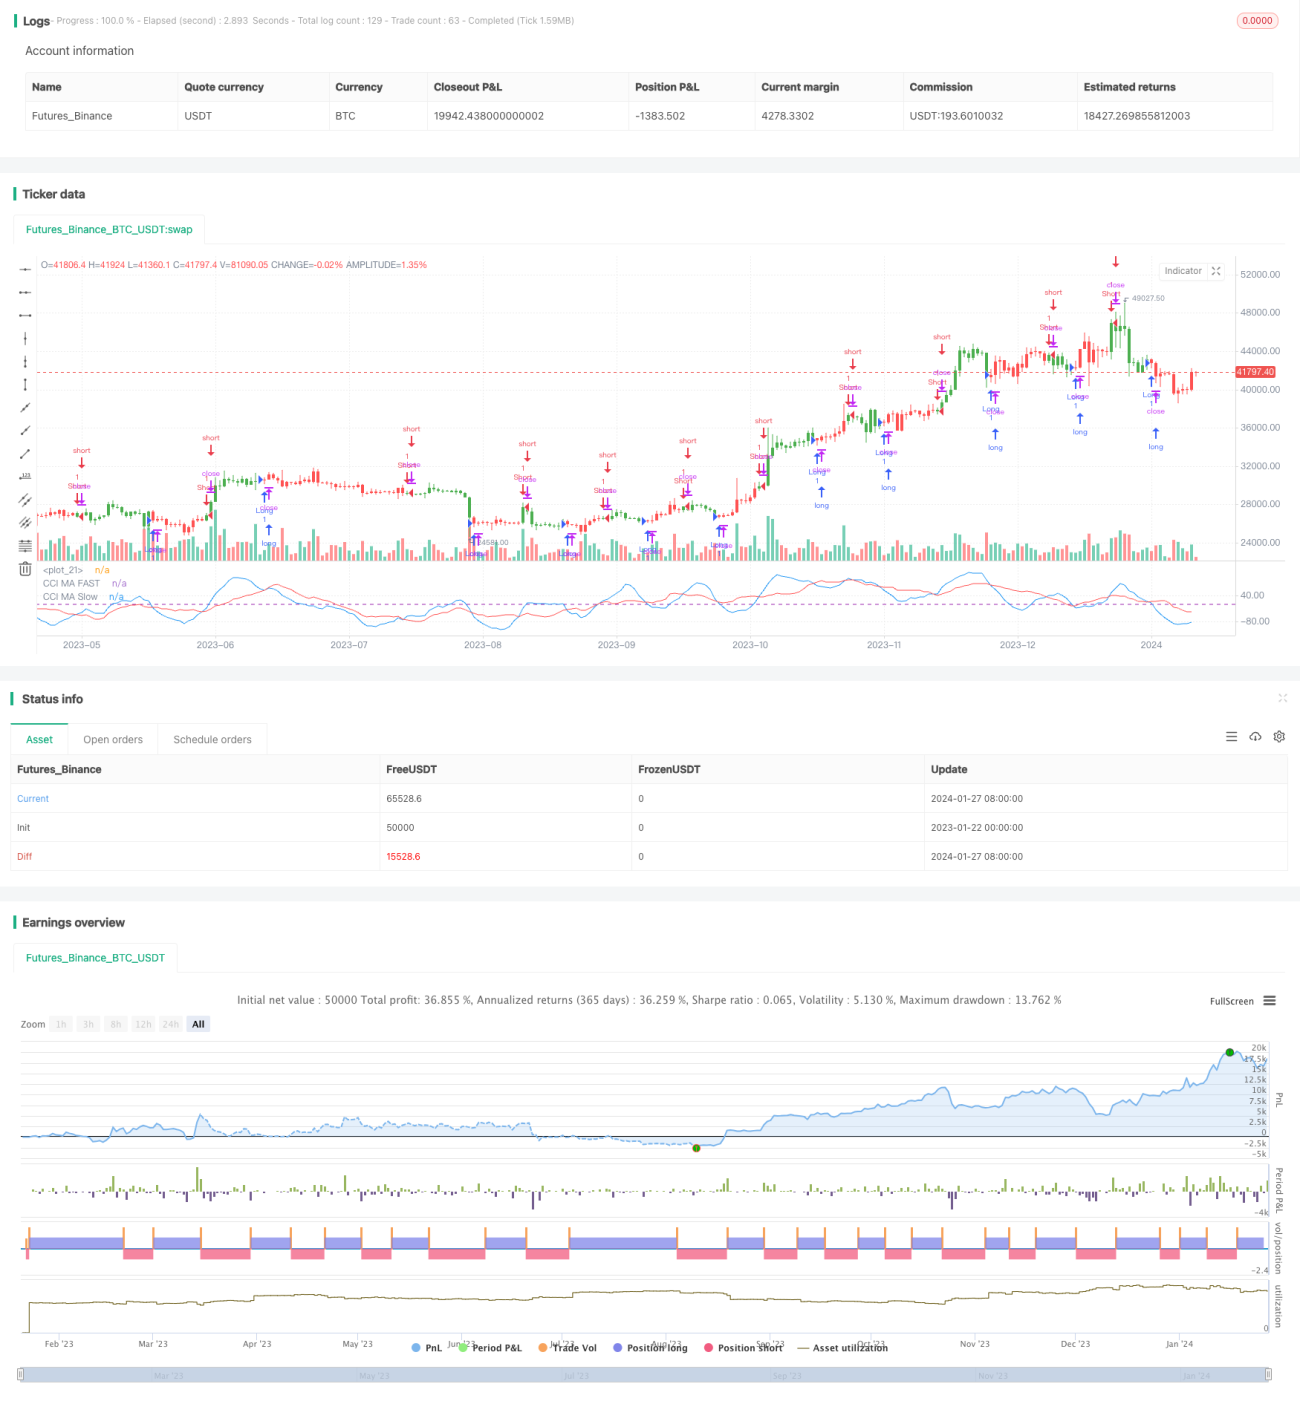
The Commodity Channel Index (CCI) value shows how the instrument is trading relative to its mean price. When the CCI value is high, it means prices are higher than the average price. When the CCI value is low, it means prices are lower than the average price. The CCI value usually does not fall outside the -300 to 300 range.
This strategy uses the CCI indicator with length 10 and its simple moving averages with length 10 and 20. It goes long when the slow moving average is below the fast one, and goes short when the slow moving average is above the fast one. The long and short can be reversed in the input settings.
Advantage Analysis
- CCI indicator can effectively identify cyclical characteristics and inflection points
- Filtered by dual moving averages to reduce false signals
- Allows selecting long or short direction for different market environments
- Controllable risks with clear stop loss levels
Risk Analysis
- CCI may not work well for stocks with large price swings
- Moving averages lag and may miss turning points
- No consideration of fundamentals, unable to judge if price is undervalued or overvalued
- Stop loss may be broken in larger time frames
Optimization can be done by adjusting CCI parameters or moving average periods, or adding other technical indicators to judge fundamentals. Larger time frame trends can also be used to avoid being trapped in larger cycles.
Optimization Directions
- Optimize CCI parameters for different cycles and volatility
- Optimize moving average periods to balance lag and noise
- Add indicators like volume to judge true breakout
- Determine overall trend in higher time frames
Summary
This strategy identifies short-term trends by using CCI and dual moving averages to judge cyclical characteristics. Its advantages are simple and clear rules, flexible parameter adjustment, and controllable risks. But there are still possibilities of lag and misjudgement. Better results can be achieved by adjusting indicator parameters and incorporating more technical or fundamental analysis.
/*backtest
start: 2023-01-22 00:00:00
end: 2024-01-28 00:00:00
period: 1d
basePeriod: 1h
exchanges: [{"eid":"Futures_Binance","currency":"BTC_USDT"}]
*/

//@version = 2
////////////////////////////////////////////////////////////
//  Copyright by HPotter v1.0 30/11/2016
// The Commodity Channel Index (CCI) is best used with markets that display cyclical or - 1