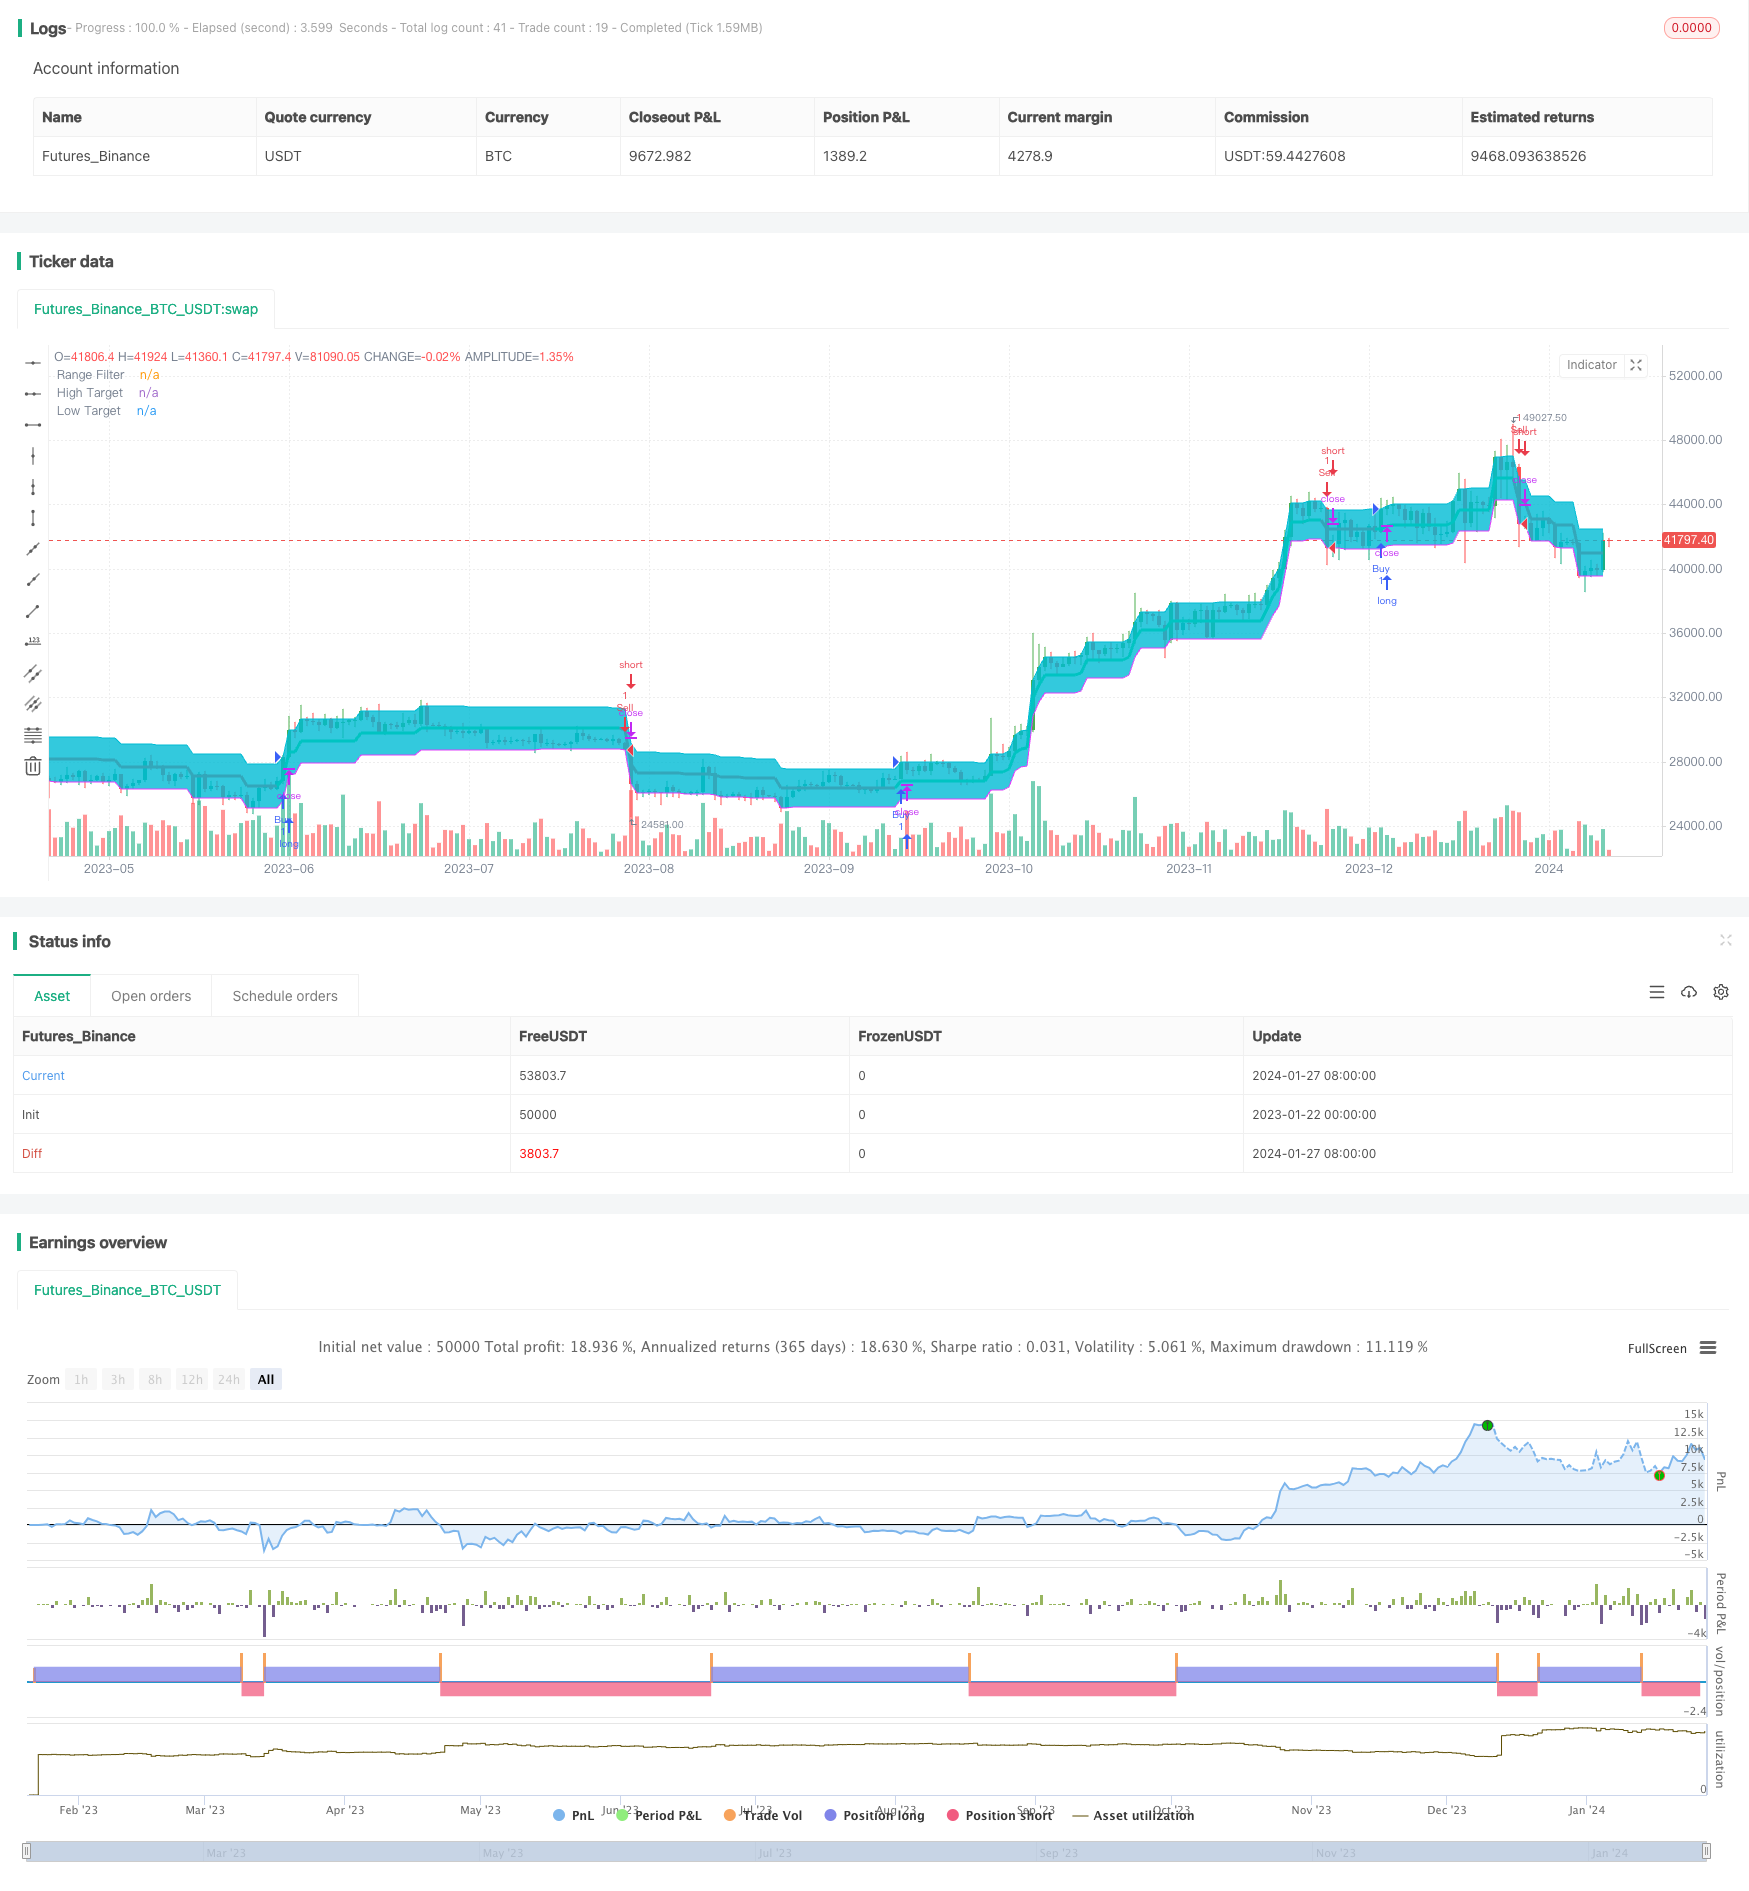
概述
本策略基于价格的平滑波动率,生成价格目标带,当价格突破目标带时,产生交易信号。
策略原理
该策略首先计算价格在一定周期内的平均波动幅度,然后通过指数移动平均线对波动幅度进行平滑处理,生成平滑波动率。平滑波动率乘以一个系数后,得到目标带的范围。当价格突破目标带上轨时,产生买入信号;当价格突破目标带下轨时,产生卖出信号。
具体来说,策略中通过smoothrng函数计算得出平滑波动率smrng,然后根据smrng值计算出目标带的上下轨hband和lband。在此基础上设定长仓条件longCondition和短仓条件shortCondition。当长仓条件满足时,产生买入信号;当短仓条件满足时,产生卖出信号。
优势分析
该策略具有以下优势:
使用价格波动率构建交易信号,可有效跟踪市场变化。
通过指数移动平均线平滑波动率,可过滤噪音,产生更可靠的交易信号。
目标带范围可通过波动率系数进行调整,使策略更加灵活。
结合价格突破判断,可在趋势发生转折时及时捕捉交易机会。
风险分析
该策略也存在一些风险:
市场出现异常波动时,平滑波动率可能无法准确反映真实波动情况,从而导致错误信号。可通过调整参数优化模型。
目标带范围如果设置不当,可能导致交易频率过高或信号不足。可测试不同的参数以找到最优范围。
突破信号判断存在时间滞后,可能导致入场过早或过晚。可结合其他指标进行确认。
优化方向
该策略可从以下几个方向进行优化:
测试不同的价格数据周期,找到计算波动率最合适的周期参数。
尝试不同的移动平均线算法,如线性加权移动平均线等。
引入交易量或其他指标来确认突破信号。
设置止损位或 trailing stop来控制单笔止损。
优化波动率系数mult的值来确定最佳目标带范围。
总结
本策略整体思路清晰,通过价格波动率构建目标带,利用价格突破产生交易信号,可有效跟踪市场变化趋势。但也存在一定改进空间,通过参数优化、引入确认指标等手段可使策略更稳健可靠。
/*backtest
start: 2023-01-22 00:00:00
end: 2024-01-28 00:00:00
period: 1d
basePeriod: 1h
exchanges: [{"eid":"Futures_Binance","currency":"BTC_USDT"}]
*/

//@version=4
strategy("1SmSm1 Strategy", shorttitle="1SmSm1", overlay=true)

// Source
src = input(defval=close, title="Source")

// Sampling Period
per = input(defval=100, minval=1, title="Sampling Period")

// Range Multiplier
mult = input(defval=3.0, minval=0.1, title="Range Multiplier")

// Smooth Average Range
smoothrng(x, t, m) =>
    wper = (t * 2) - 1
    avrng = ema(abs(x - x[1]), t)
    smoothrng = ema(avrng, wper) * m
    smoothrng

smrng = smoothrng(src, per, mult)

// Range Filter
rngfilt(x, r) =>
    rngfilt = x
    rngfilt := x > nz(rngfilt[1]) ? ((x - r) < nz(rngfilt[1]) ? nz(rngfilt[1]) : (x - r)) : ((x + r) > nz(rngfilt[1]) ? nz(rngfilt[1]) : (x + r))
    rngfilt

filt = rngfilt(src, smrng)

// Filter Direction
upward = 0.0
upward := filt > filt[1] ? nz(upward[1]) + 1 : filt < filt[1] ? 0 : nz(upward[1])

downward = 0.0
downward := filt < filt[1] ? nz(downward[1]) + 1 : filt > filt[1] ? 0 : nz(downward[1])

// Target Bands
hband = filt + smrng
lband = filt - smrng

// Breakouts
longCondition = (src > filt) and (src > src[1]) and (upward > 0)
shortCondition = (src < filt) and (src < src[1]) and (downward > 0)

strategy.entry("Buy", strategy.long, when = longCondition)
strategy.entry("Sell", strategy.short, when = shortCondition)

// Plotting
plot(filt, color=upward > 0 ? color.lime : downward > 0 ? color.red : color.orange, linewidth=3, title="Range Filter")
hbandplot = plot(hband, color=color.aqua, transp=100, title="High Target")
lbandplot = plot(lband, color=color.fuchsia, transp=100, title="Low Target")

// Fills
fill(hbandplot, lbandplot, color=color.aqua, title="Target Range")

// Bar Color
barcolor(longCondition ? color.green : shortCondition ? color.red : na)

// Alerts
alertcondition(longCondition, title="Buy Alert", message="BUY")
alertcondition(shortCondition, title="Sell Alert", message="SELL")