概述
本策略基于平滑后的相对强弱指数(RSI)来确定买入和卖出信号,属于比较典型的趋势跟踪策略。通过计算一定时期内股票价格涨跌的幅度,帮助投资者判断市场是处于超买还是超卖状态,从而制定投资决策。
策略原理
- 计算股票在5天内的RSI值
- 对RSI值进行5日简单移动平均,得到平滑后的RSI指标
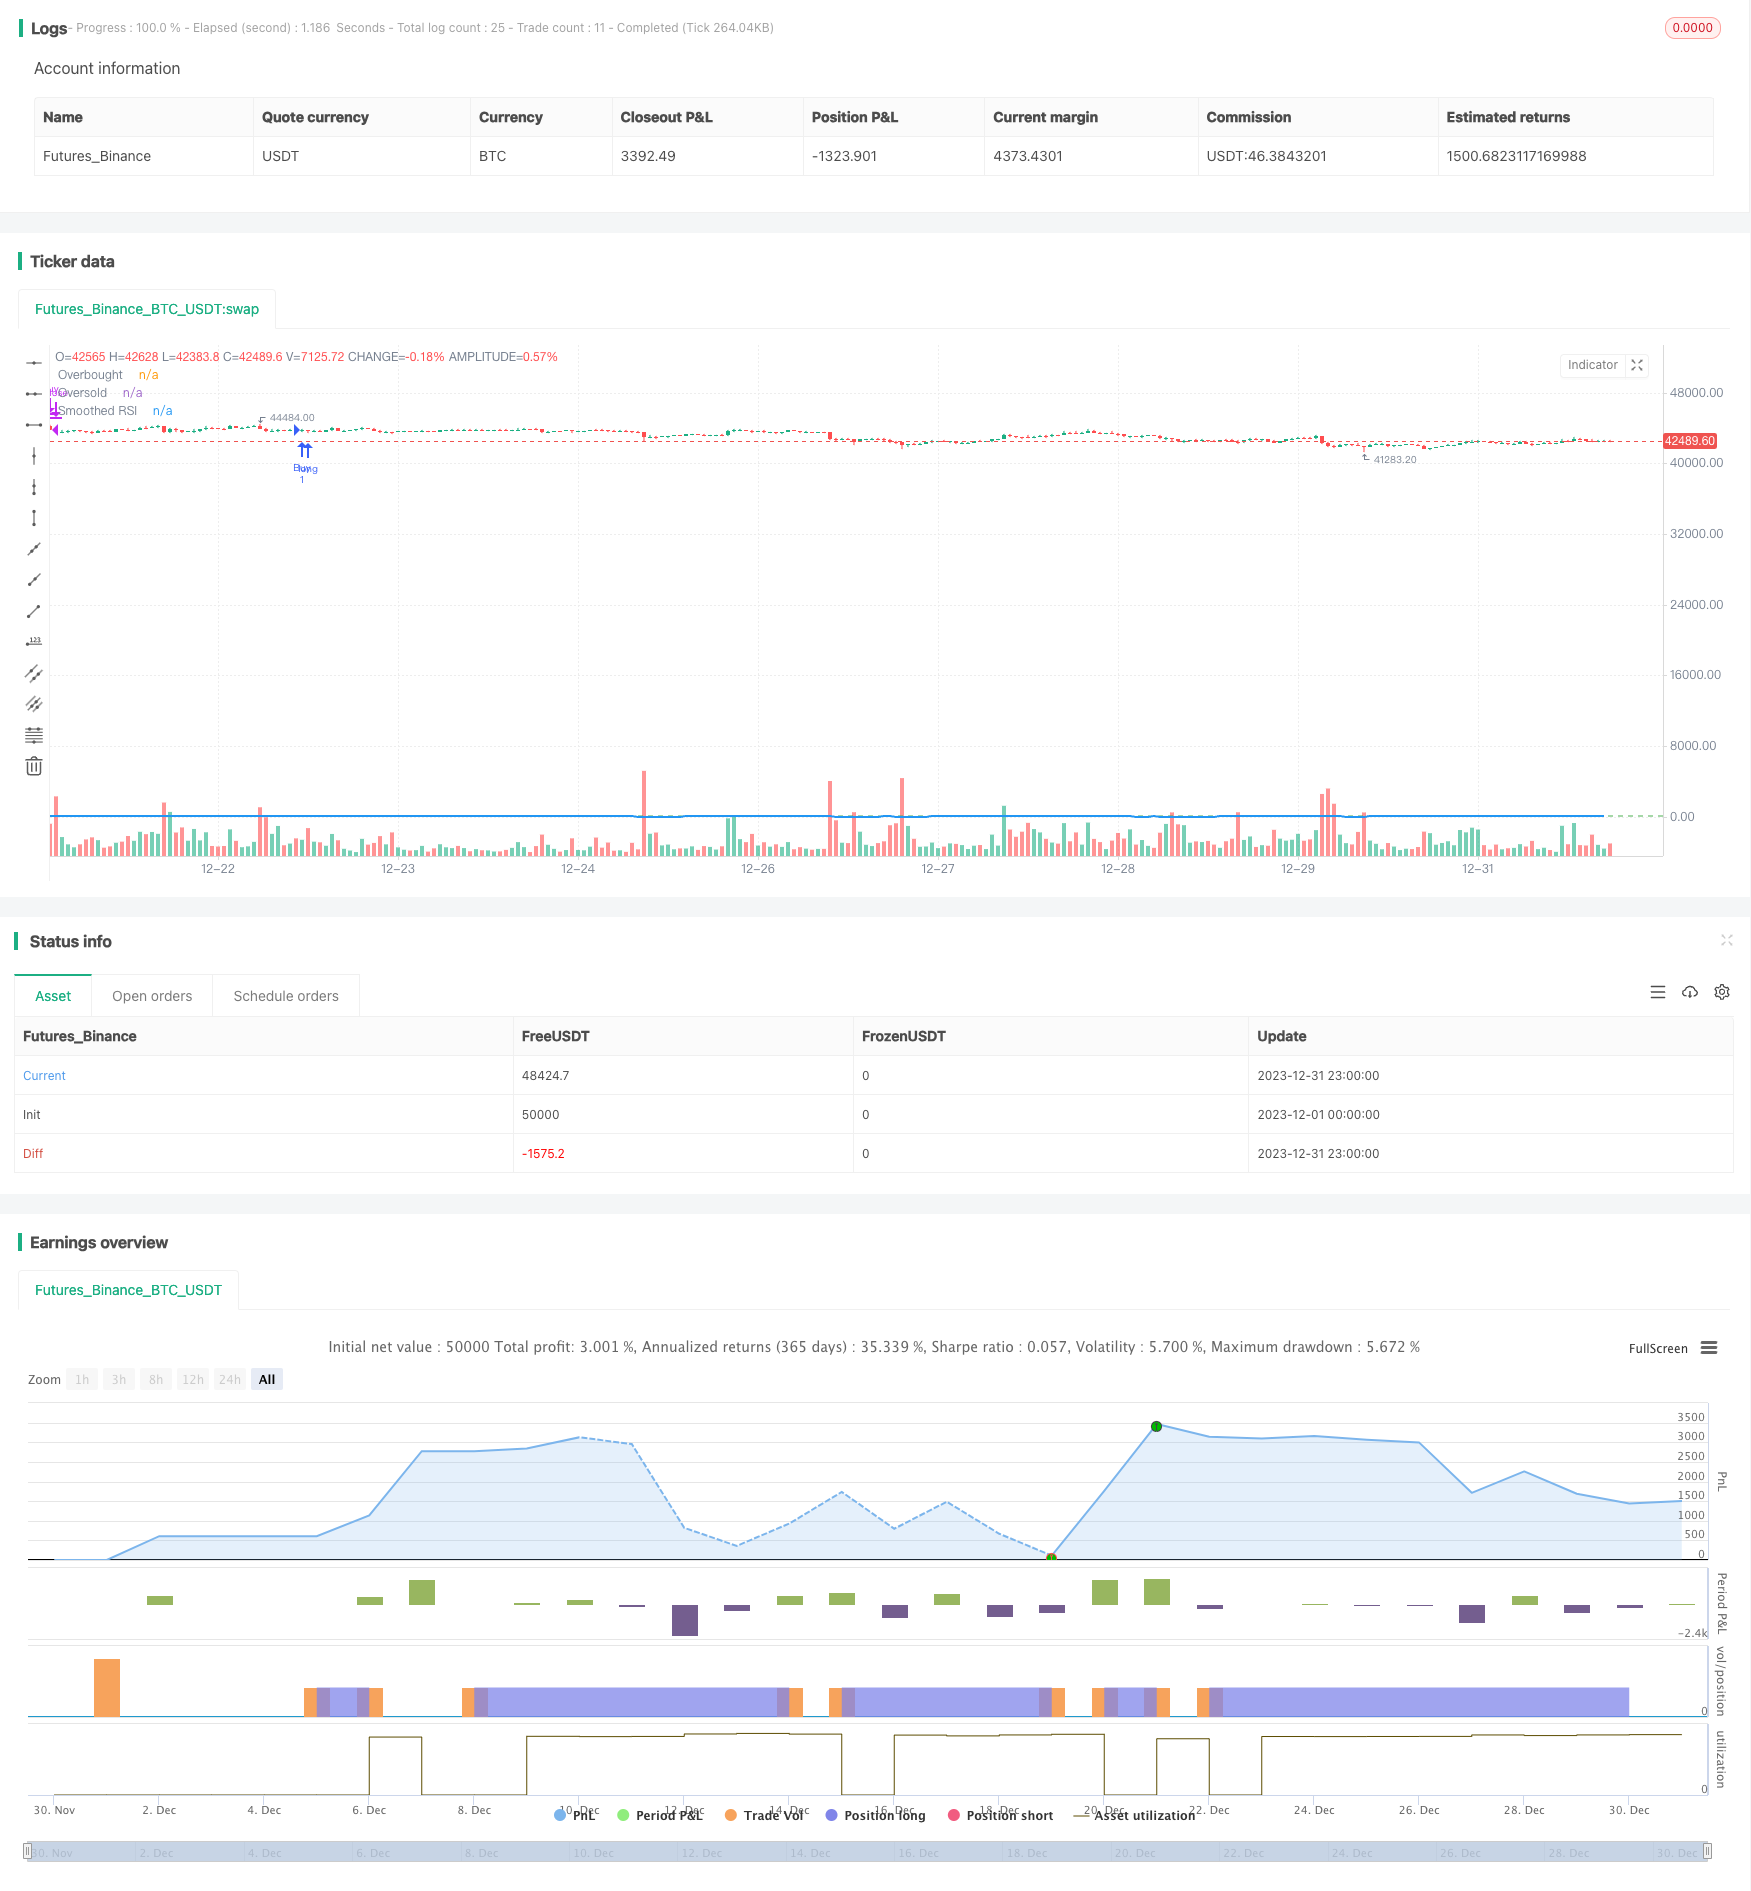
- 设置超买线为80,超卖线为40
- 当平滑RSI上穿超卖线时,产生买入信号
- 当平滑RSI下穿超买线时,产生卖出信号
该策略的关键在于平滑RSI指标的设定。RSI指标能够反映股票价格的超买超卖情况。但是原始RSI指标随着价格的波动也会很剧烈,不利于产生交易信号。因此,本策略对其进行了平滑处理,采用5日简单移动平均,能够有效过滤掉部分噪音,使得交易信号更加清晰可靠。
优势分析
- 平滑RSI指标增强了RSI指标本身的稳定性,使得交易信号更加可靠
- 采用简单移动平均进行RSI指标平滑,实现了参数优化,避免人为设定阈值带来的局限性
- 结合超买超卖区域,能够清晰地判断市场状态,产生买入卖出信号
- 策略实现简单,容易理解和运用
风险及优化分析
- 平滑RSI指标降低了RSI指标的灵敏度,可能导致买入卖出延迟
- 移动平均长度和超买超卖阈值的设定会影响策略表现,需要进行参数优化
- 交易信号可能出现假阳性和假阴性,应结合价格走势和交易量等因素进行分析
- 只依赖RSI指标可能导致策略表现不稳定,可以考虑结合其他技术指标或基本面指标
优化方向
- 调整移动平均天数和超买超卖阈值,优化参数
- 增加其他技术指标,如MACD、KD等,形成综合交易信号
- 添加交易量的过滤机制,避免在价格异动但交易量不活跃的时候产生错误信号
- 结合股票的基本面情况和行业景气度,提高策略的稳定性
- 增加止损策略,在交易亏损达到一定幅度时止损退出,控制风险
总结
本策略通过计算并对RSI指标进行平滑处理,设定合理的超买超卖区域,产生比较清晰的买入卖出信号。相比原始RSI策略,具有信号更加稳定可靠的优点。但也存在一定的改进空间,投资者可以通过参数优化、增加其他指标等方式进行策略增强,使其能够适应更加复杂的市场环境。
策略源码
/*backtest
start: 2023-12-01 00:00:00
end: 2023-12-31 23:59:59
period: 1h
basePeriod: 15m
exchanges: [{"eid":"Futures_Binance","currency":"BTC_USDT"}]
*/

//@version=5
strategy("Smoothed RSI Strategy", overlay=true)

// Calculate the RSI
length = 5
rsiValue = ta.rsi(close, length)

// Smooth the RSI using a moving average
smoothedRsi = ta.sma(rsiValue, length)

// Define overbought and oversold thresholds
overbought = 80
oversold = 40

// Buy signal when RSI is in oversold zone
buyCondition = ta.crossover(smoothedRsi, oversold)

// Sell signal when RSI is in overbought zone
sellCondition = ta.crossunder(smoothedRsi, overbought)

// Plotting the smoothed RSI
// Plotting the smoothed RSI in a separate pane
plot(smoothedRsi, color=color.blue, title="Smoothed RSI", style=plot.style_line, linewidth=2)

//plot(smoothedRsi, color=color.blue, title="Smoothed RSI")
hline(overbought, "Overbought", color=color.red)
hline(oversold, "Oversold", color=color.green)

// Strategy logic for buying and selling
if (buyCondition)
    strategy.entry("Buy", strategy.long)
if (sellCondition)
    strategy.close("Buy")