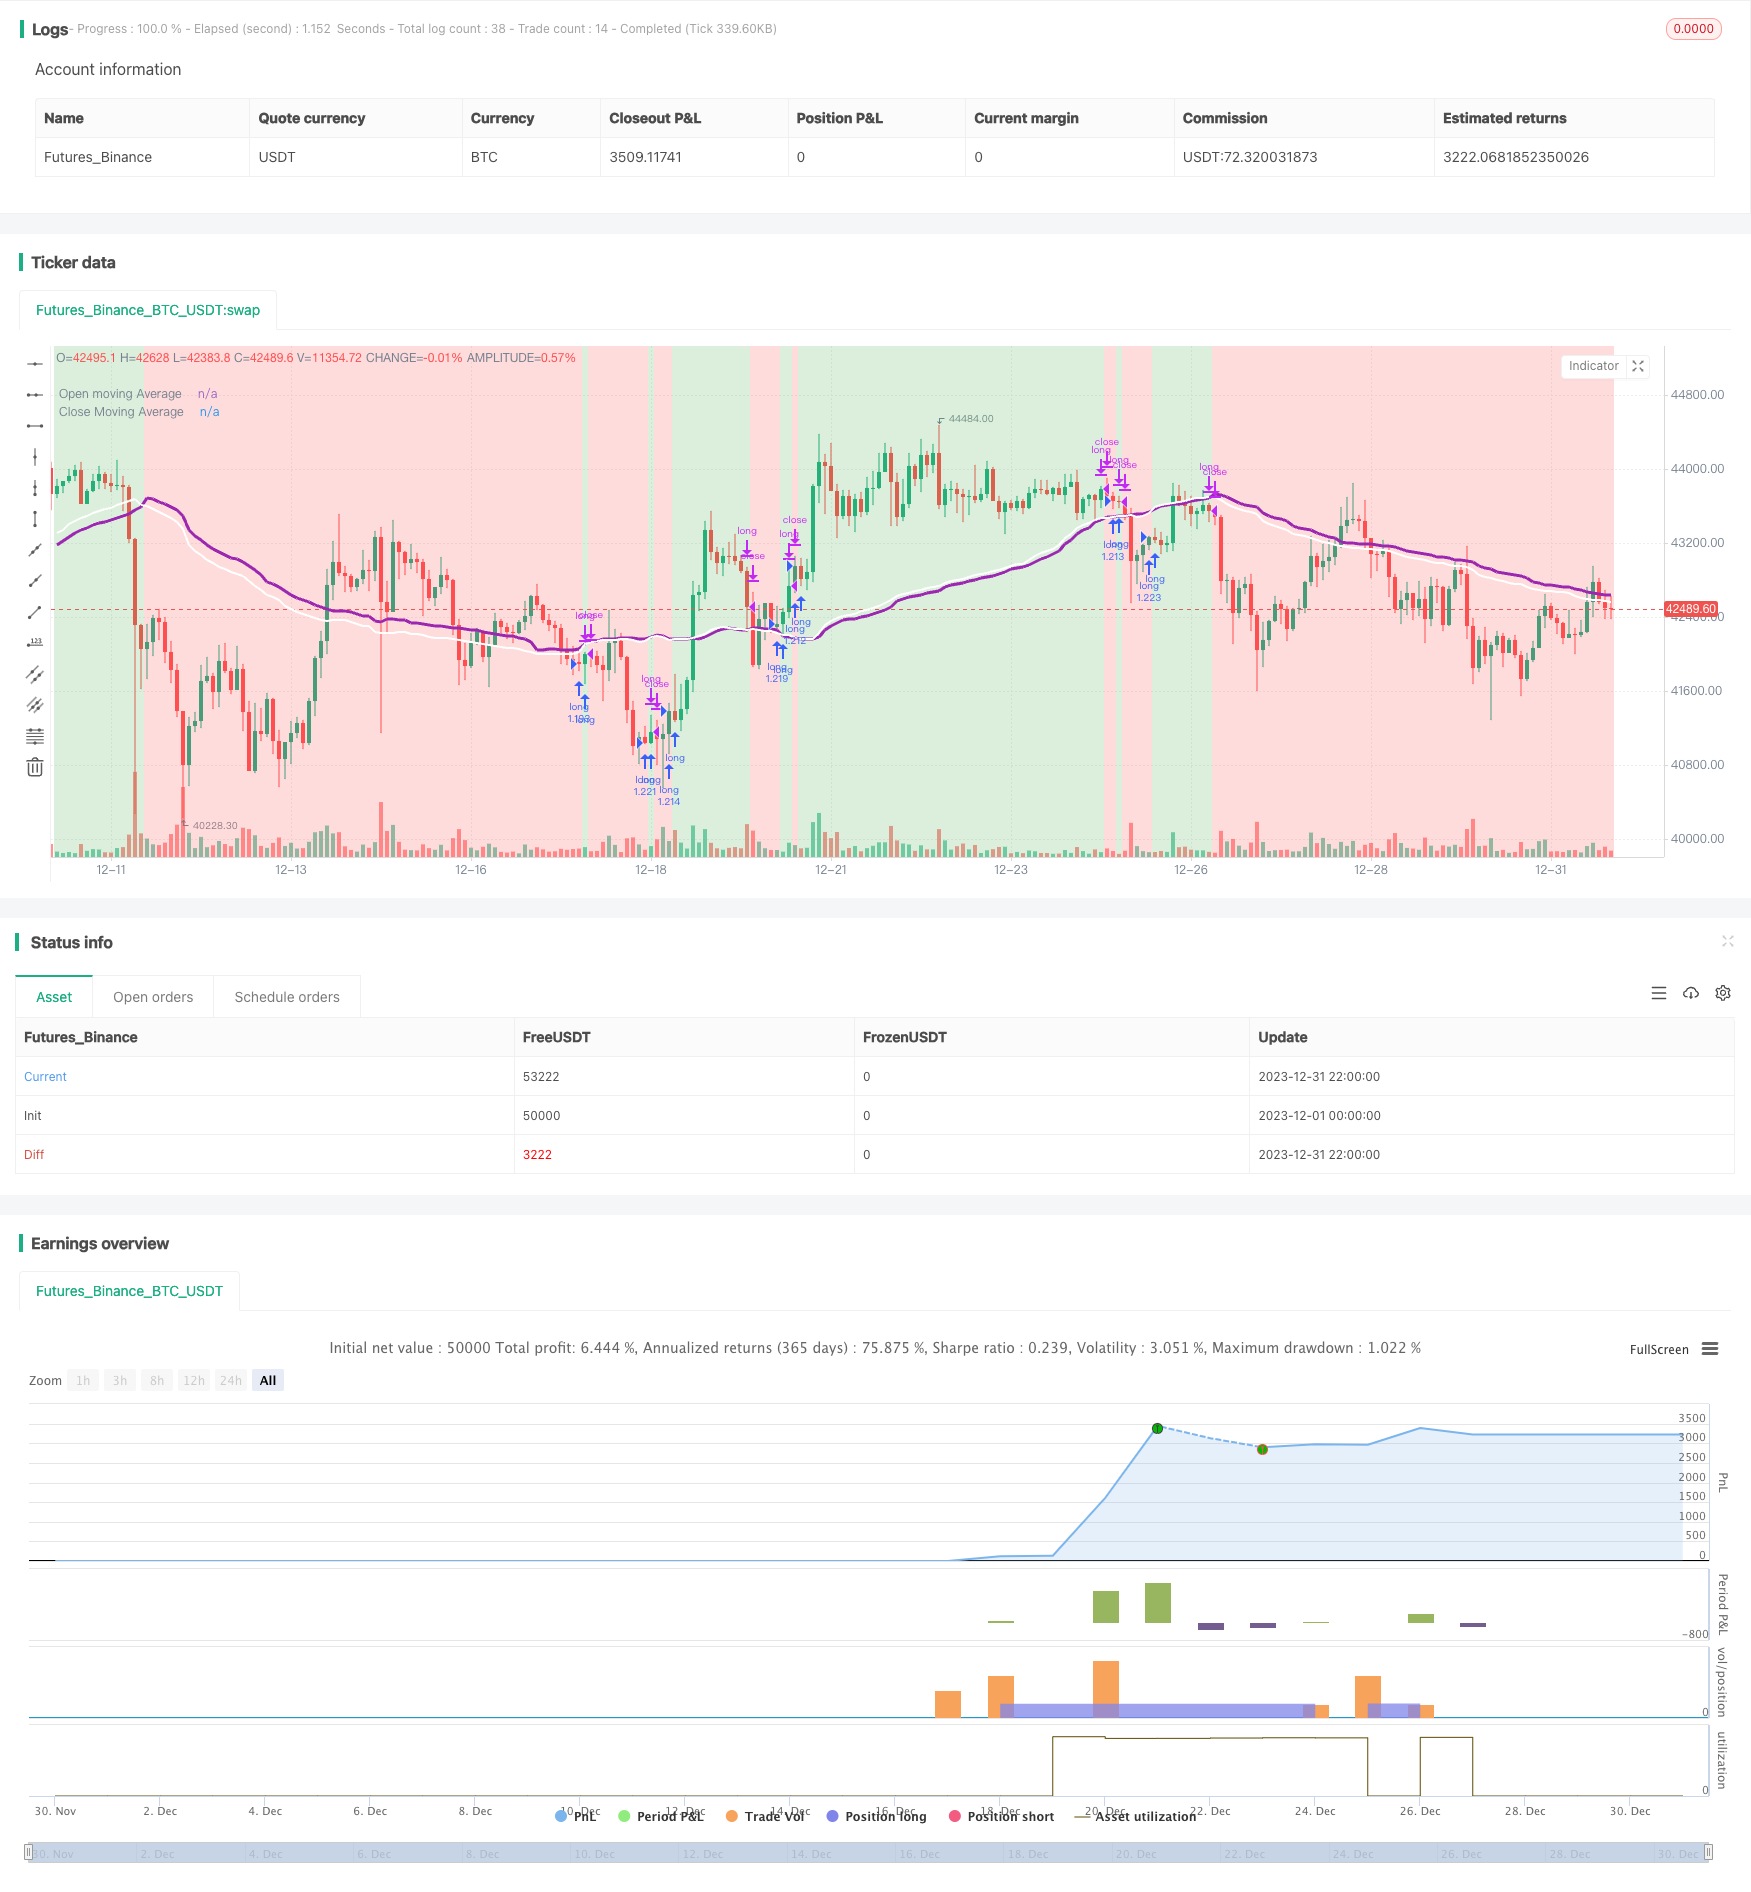
概述
这个策略是基于移动平均线的简单策略,它可以在不同的币对上取得不错的效果。它绘制开盘平均线和收盘平均线,当两条线交叉时决定建立或者退出多头头寸。其原理是当平均收盘价上升时建立头寸,这可能预示着未来价格会上涨。当平均收盘价下降时平掉头寸,这可能预示着未来价格会下跌。这只是一种猜测,但有时它可以非常准确的预测未来价格。
策略原理
这个策略首先根据设置选择移动平均线的类型,包括EMA、SMA、RMA、WMA和VWMA。然后设置移动平均线计算的周期,一般是10到250根K线。根据不同的币对,选择不同的移动平均线类型和周期数可以获得完全不同的效果。
该策略的具体交易逻辑是: 1. 计算开盘价和收盘价的移动平均线; 2. 比较收盘价平均线和开盘价平均线的数值; 3. 如果收盘价平均线上穿开盘价平均线,则建立多头头寸; 4. 如果收盘价平均线下穿开盘价平均线,则平掉多头头寸。
建立头寸时认为是价格上涨的预兆,平仓时认为是价格下跌的预兆。
策略优势分析
该策略主要有以下几个优势:
- 参数设置灵活,可以根据不同币对选择最优参数,从而针对性很强;
- 逻辑简单,容易理解和实现;
- 在部分币对可以获得非常高的收益率,总体来说稳定性较好;
- 可以根据需求选择显示不同指标,自定义程度高。
风险分析
该策略也存在一些风险:
- 在部分币对和参数下,收益率和稳定性都不高;
- 无法有效响应短期价格变动,对高波动币对效果不佳;
- 选取移动平均线周期的依据不够科学合理,有一定的主观性。
对策和优化方向: 1. 尽量选择长周期,如12小时、1天等时间周期,可以减少不必要的交易,提高稳定性; 2. 增加参数优化功能,自动测试不同参数组合,找出最优参数; 3. 增加自适应选取移动平均线周期的功能,让系统自动决定最佳周期。
总结
本策略总体来说逻辑简单,使用移动平均线指标判断价格趋势和转折点。它可以通过调整参数取得非常好的效果,是一种有效的趋势跟踪策略,值得进一步完善和应用。但也应注意控制风险,选择合适的币对和参数,使其发挥最大效用。
策略源码
/*backtest
start: 2023-12-01 00:00:00
end: 2023-12-31 23:59:59
period: 2h
basePeriod: 15m
exchanges: [{"eid":"Futures_Binance","currency":"BTC_USDT"}]
*/

//@version=5
//Author @divonn1994

initial_balance = 100
strategy(title='Close v Open Moving Averages Strategy', shorttitle = 'Close v Open', overlay=true, pyramiding=0, default_qty_value=100, default_qty_type=strategy.percent_of_equity, precision=7, currency=currency.USD, commission_value=0.1, commission_type=strategy.commission.percent, initial_capital=initial_balance)

//Input for number of bars for moving average, Switch to choose moving average type, Display Options and Time Frame of trading----------------------------------------------------------------

bars = input.int(66, "Moving average length (number of bars)", minval=1, group='Strategy') //66 bars and VWMA for BTCUSD on 12 Hours.. 35 bars and VWMA for BTCUSD on 1 Day
strategy = input.string("VWMA", "Moving Average type", options = ["EMA", "SMA", "RMA", "WMA", "VWMA"], group='Strategy')

redOn = input.string("On", "Red Background Color On/Off", options = ["On", "Off"], group='Display')
greenOn = input.string("On", "Green Background Color On/Off", options = ["On", "Off"], group='Display')
maOn = input.string("On", "Moving Average Plot On/Off", options = ["On", "Off"], group='Display')

startMonth = input.int(title='Start Month 1-12 (set any start time to 0 for furthest date)', defval=1, minval=0, maxval=12, group='Beginning of Strategy')
startDate = input.int(title='Start Date 1-31 (set any start time to 0 for furthest date)', defval=1, minval=0, maxval=31, group='Beginning of Strategy')
startYear = input.int(title='Start Year 2000-2100 (set any start time to 0 for furthest date)', defval=2011, minval=2000, maxval=2100, group='Beginning of Strategy')

endMonth = input.int(title='End Month 1-12 (set any end time to 0 for today\'s date)', defval=0, minval=0, maxval=12, group='End of Strategy')
endDate = input.int(title='End Date 1-31 (set any end time to 0 for today\'s date)', defval=0, minval=0, maxval=31, group='End of Strategy')
endYear = input.int(title='End Year 2000-2100 (set any end time to 0 for today\'s date)', defval=0, minval=0, maxval=2100, group='End of Strategy')

//Strategy Calculations-----------------------------------------------------------------------------------------------------------------------------------------------------------------------

inDateRange = true

maMomentum = switch strategy
    "EMA" => (ta.ema(close, bars) > ta.ema(open, bars)) ? 1 : -1
    "SMA" => (ta.sma(close, bars) > ta.sma(open, bars)) ? 1 : -1
    "RMA" => (ta.rma(close, bars) > ta.rma(open, bars)) ? 1 : -1
    "WMA" => (ta.wma(close, bars) > ta.wma(open, bars)) ? 1 : -1
    "VWMA" => (ta.vwma(close, bars) > ta.vwma(open, bars)) ? 1 : -1
    =>
        runtime.error("No matching MA type found.")
        float(na)

openMA = switch strategy
    "EMA" => ta.ema(open, bars)
    "SMA" => ta.sma(open, bars)
    "RMA" => ta.rma(open, bars)
    "WMA" => ta.wma(open, bars)
    "VWMA" => ta.vwma(open, bars)
    =>
        runtime.error("No matching MA type found.")
        float(na)

closeMA = switch strategy
    "EMA" => ta.ema(close, bars)
    "SMA" => ta.sma(close, bars)
    "RMA" => ta.rma(close, bars)
    "WMA" => ta.wma(close, bars)
    "VWMA" => ta.vwma(close, bars)
    =>
        runtime.error("No matching MA type found.")
        float(na)

//Enter or Exit Positions--------------------------------------------------------------------------------------------------------------------------------------------------------------------

if ta.crossover(maMomentum, 0)
    if inDateRange
        strategy.entry('long', strategy.long, comment='long')
if ta.crossunder(maMomentum, 0)
    if inDateRange
        strategy.close('long')

//Plot Strategy Behavior---------------------------------------------------------------------------------------------------------------------------------------------------------------------

plot(series = maOn == "On" ? openMA : na, title = "Open moving Average", color = color.new(color.purple,0), linewidth=3, offset=1)
plot(series = maOn == "On" ? closeMA : na, title = "Close Moving Average", color = color.new(color.white,0), linewidth=2, offset=1)
bgcolor(color = inDateRange and (greenOn == "On") and maMomentum > 0 ? color.new(color.green,75) : inDateRange and (redOn == "On") and maMomentum <= 0 ? color.new(color.red,75) : na, offset=1)